 Sign in

Salesforce dashboard examples: real-time KPIs for your sales team
Turn Salesforce opportunities, leads and tasks into a live dashboard your team can see on a TV or phone, with targets, leaderboards and contests.
What is a Salesforce dashboard?
A Salesforce dashboard is a visual summary of the records in your Salesforce CRM, such as opportunities, leads and tasks, shown as KPIs, charts and tables. Salesforce has its own dashboards for analysis inside the CRM. A real-time Salesforce dashboard built in Plecto instead puts the same numbers on a TV or phone, with targets and leaderboards, so the whole sales team sees them without logging in.
Below are three Salesforce dashboard examples built in Plecto, the KPIs worth putting on one, and how to build your own. Plecto connects to Salesforce through a native integration and refreshes the data every 2 minutes.
Salesforce dashboard examples for sales teams
Sales development Salesforce dashboard
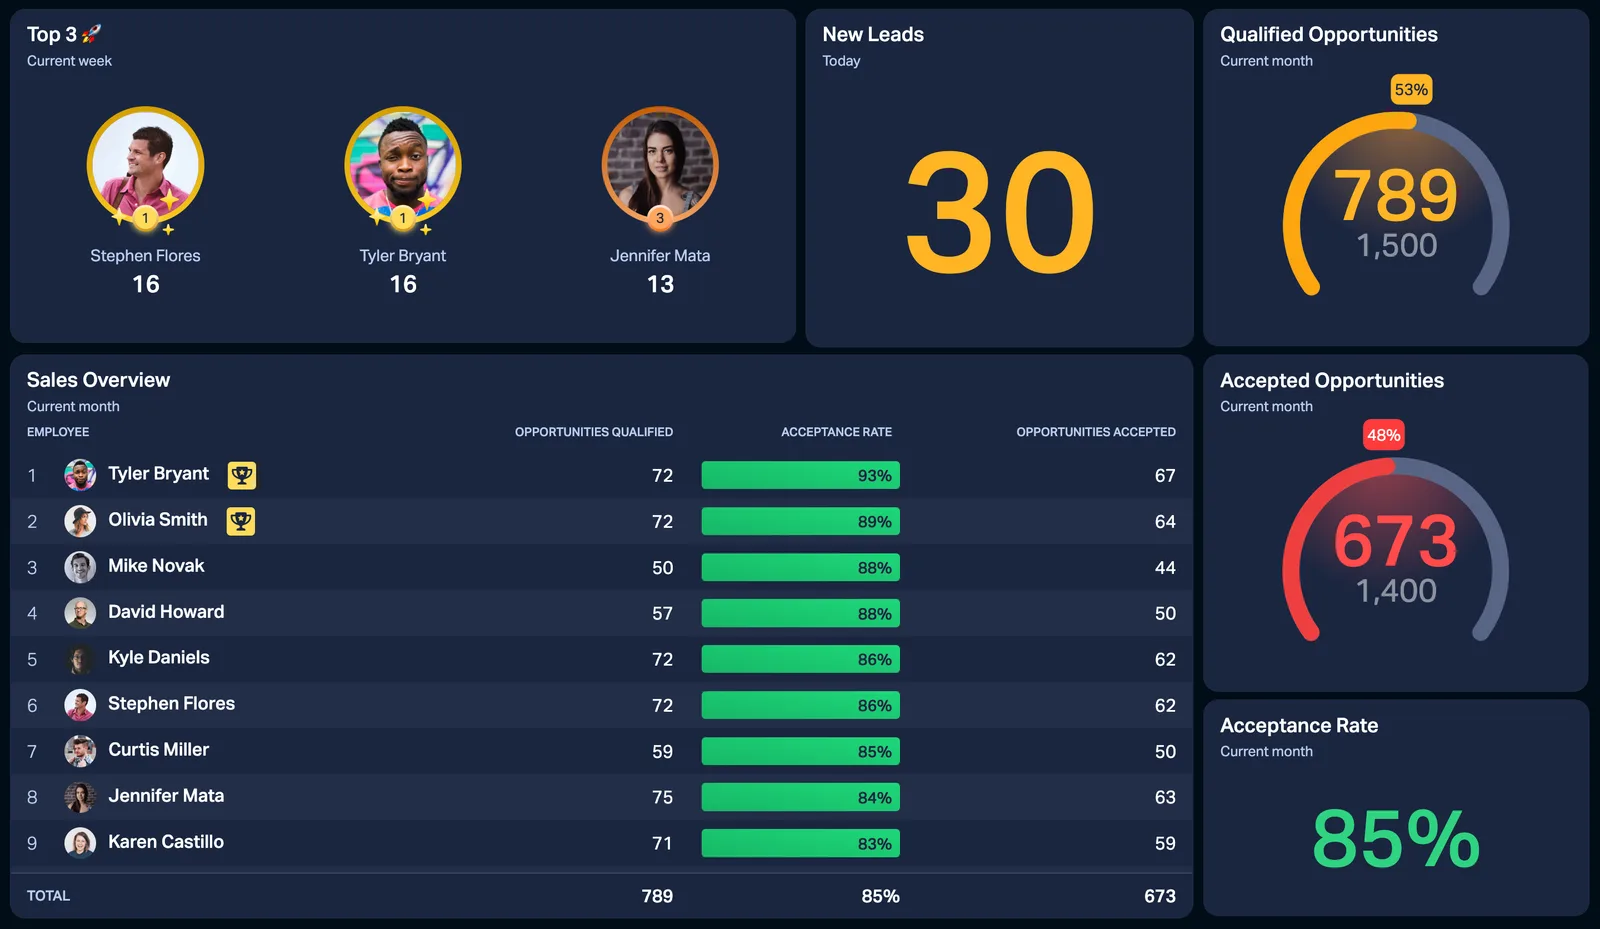
The dashboard in the hero is a Sales Development view built on Salesforce data. It shows the top three reps with their photos, new leads today, and gauges for qualified opportunities (789 against a 1,500 target) and accepted opportunities (673 against 1,400). An acceptance rate of 85% sits beside them, and a Sales Overview table breaks it down per employee.
It works because the day's targets are visible at a glance. A rep who is behind can see it, and a manager can see which handoffs between lead qualification and acceptance are leaking.
Sales agent performance Salesforce dashboard
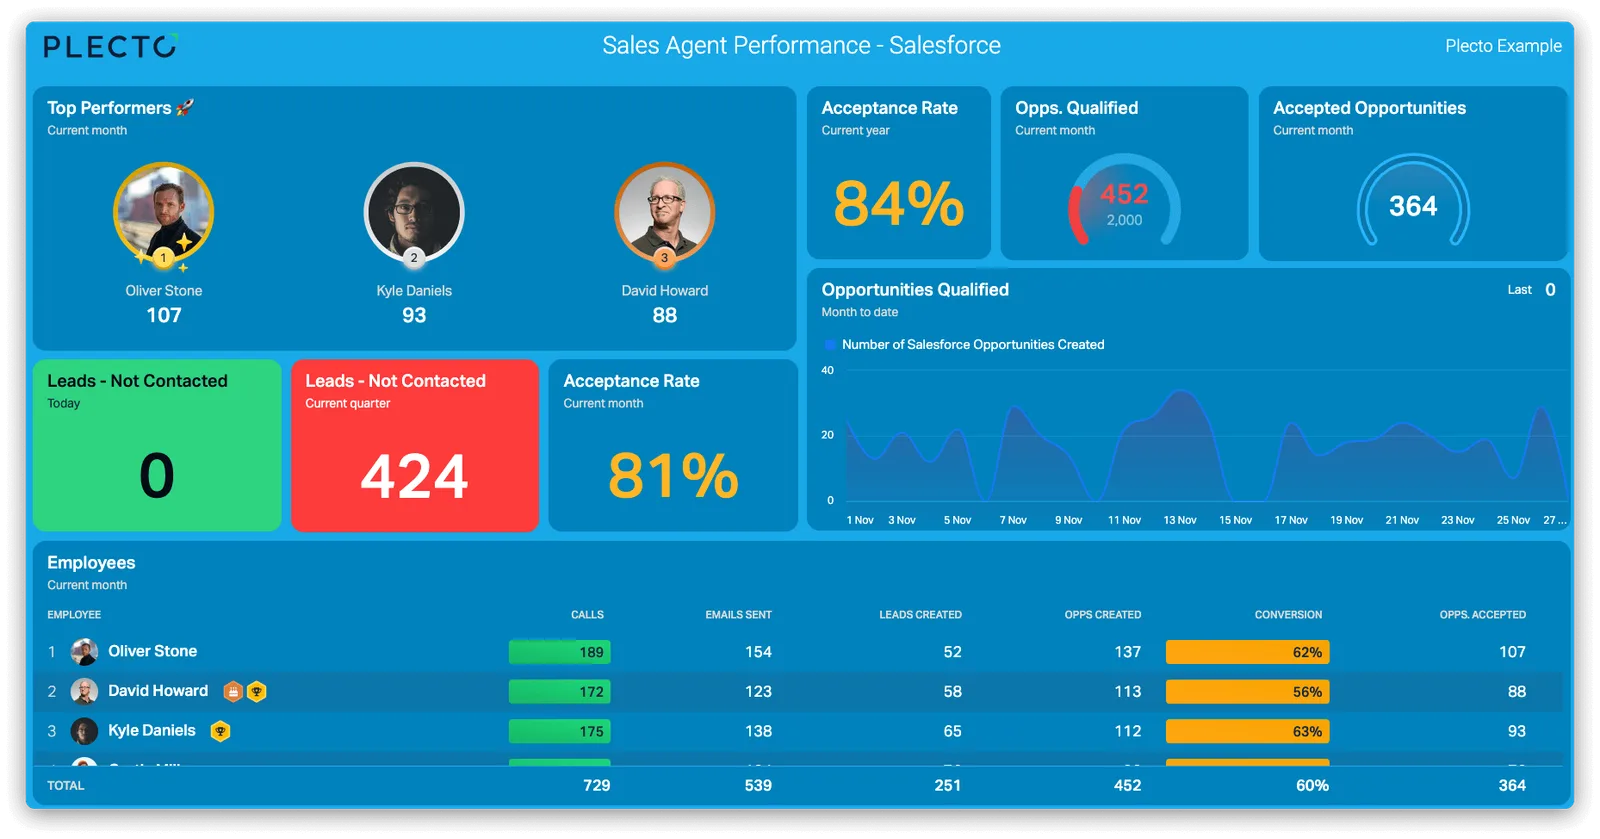
This blue Sales Agent Performance dashboard puts the same Salesforce data to work for team leads. It shows the top performers, acceptance rate, opportunities qualified and accepted, and a line chart of qualified opportunities over time. An employees table lists calls, emails, opportunities and conversion per person.
Two tiles use conditional colors: Leads Not Contacted is green at 0 and red at 424. Anyone looking at the screen knows which number needs action before they read it.
A Salesforce dashboard with a sales contest
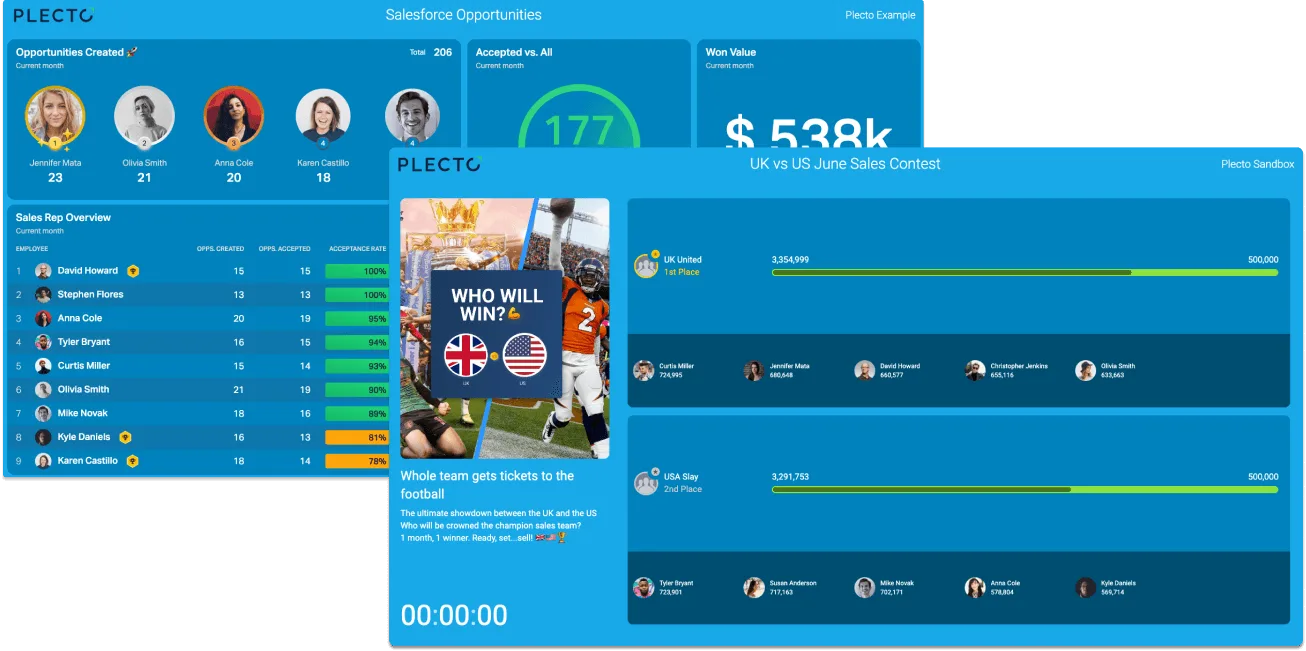
A dashboard shows where the team stands. A contest gives people a reason to move the number. This example pairs a Salesforce opportunities dashboard with a "UK vs US June Sales Contest" screen that has a "who will win" banner and a countdown timer, all driven by Salesforce data.
Rank reps or whole teams on closed-won opportunities, logged calls or any other Salesforce KPI, then show the contest on the same slideshow as your dashboards. Contests and the Reward Store are on the Large and Enterprise plans. Read more about sales contests and sales leaderboards.
Which KPIs belong on a Salesforce KPI dashboard?
Keep the main screen to a handful of numbers reps can act on today.
Number of opportunities
How much pipeline is being created. Count Salesforce opportunities by created date, and split them by rep or stage.
Number of won deals
The number the team is measured on. In Salesforce, that means opportunities with the stage Closed Won, counted by close date.
Win rate of deals
The share of opportunities you convert. It shows whether more pipeline or better selling is the lever to pull.
Weighted pipeline value
What is still open, weighted by stage, so a big early-stage deal does not inflate the forecast.
Number of new leads
The top of the funnel. Count Salesforce leads with the status New Lead, as in our Salesforce KPI formulas.
Lead response time
How fast reps follow up on new leads. A slow response is easy to spot with a red conditional color.
Looking for more? Our guide to 10 important Salesforce KPIs covers average sales cycle length, sales activities and lead conversion, and the full sales dashboards library has ready layouts. Deal value is covered by average deal size.
Native Salesforce dashboards vs a real-time Salesforce dashboard
Salesforce's own reports and dashboards are the right place for analysis. They cover every standard and custom object in your org and need no extra tool. If the people who need the numbers already work in Salesforce, start there.
A real-time Salesforce dashboard solves a different problem: getting numbers in front of people who are not looking at the CRM.
- A screen for the floor. Salesforce's help describes refreshing a dashboard with the Refresh button or on a subscription schedule, so check how a wall-mounted screen would stay current. In Plecto, Salesforce data updates every 2 minutes, and Salesforce Chat is streamed live.
- Targets and motivation. Gauges against a target, conditional colors, leaderboards and contests are built for the floor. A standard Salesforce report does not provide them.
- More than Salesforce. Show calls, tickets or marketing data next to pipeline on one dashboard, using any of our 150+ integrations.
Plecto is not a replacement for your CRM or for deep analysis. Many teams keep Salesforce as the system of record and add Plecto as the live layer on top. Read the full comparison in our Salesforce dashboard tools guide.
Business dashboard tools that integrate with Salesforce
Many business dashboard tools integrate with Salesforce, and they do different jobs. Here is how the main groups compare.
| Tool type | Fits when | Keep in mind |
|---|---|---|
| Native Salesforce reports and dashboards (CRM Analytics or Tableau as paid upgrades) | You want analysis inside the CRM, with access to every object in your org | No targets, contests or leaderboards built for a sales floor |
| BI tools such as Power BI | You want to model Salesforce with finance, ERP and other data in one governed model | Built for analysis, not a rep-facing TV; refreshes are scheduled |
| Plecto | You want a real-time Salesforce KPI dashboard on TVs and phones, with targets, leaderboards and contests, plus other systems next to Salesforce | Not a BI warehouse; Salesforce data updates every 2 minutes; contests are on Large and Enterprise |
Many teams use more than one: a BI tool for analysis, and Plecto for the live floor. See the comparison of Salesforce dashboard tools for Geckoboard, Databox, Klipfolio, Coefficient and Coupler.io as well, or compare directly with Plecto vs Tableau.
Automate Salesforce dashboard reporting
A live dashboard tells you how the day is going. A report tells you how the week or month went. Plecto reports sit on the same Salesforce data, so you do not rebuild the numbers in a spreadsheet.
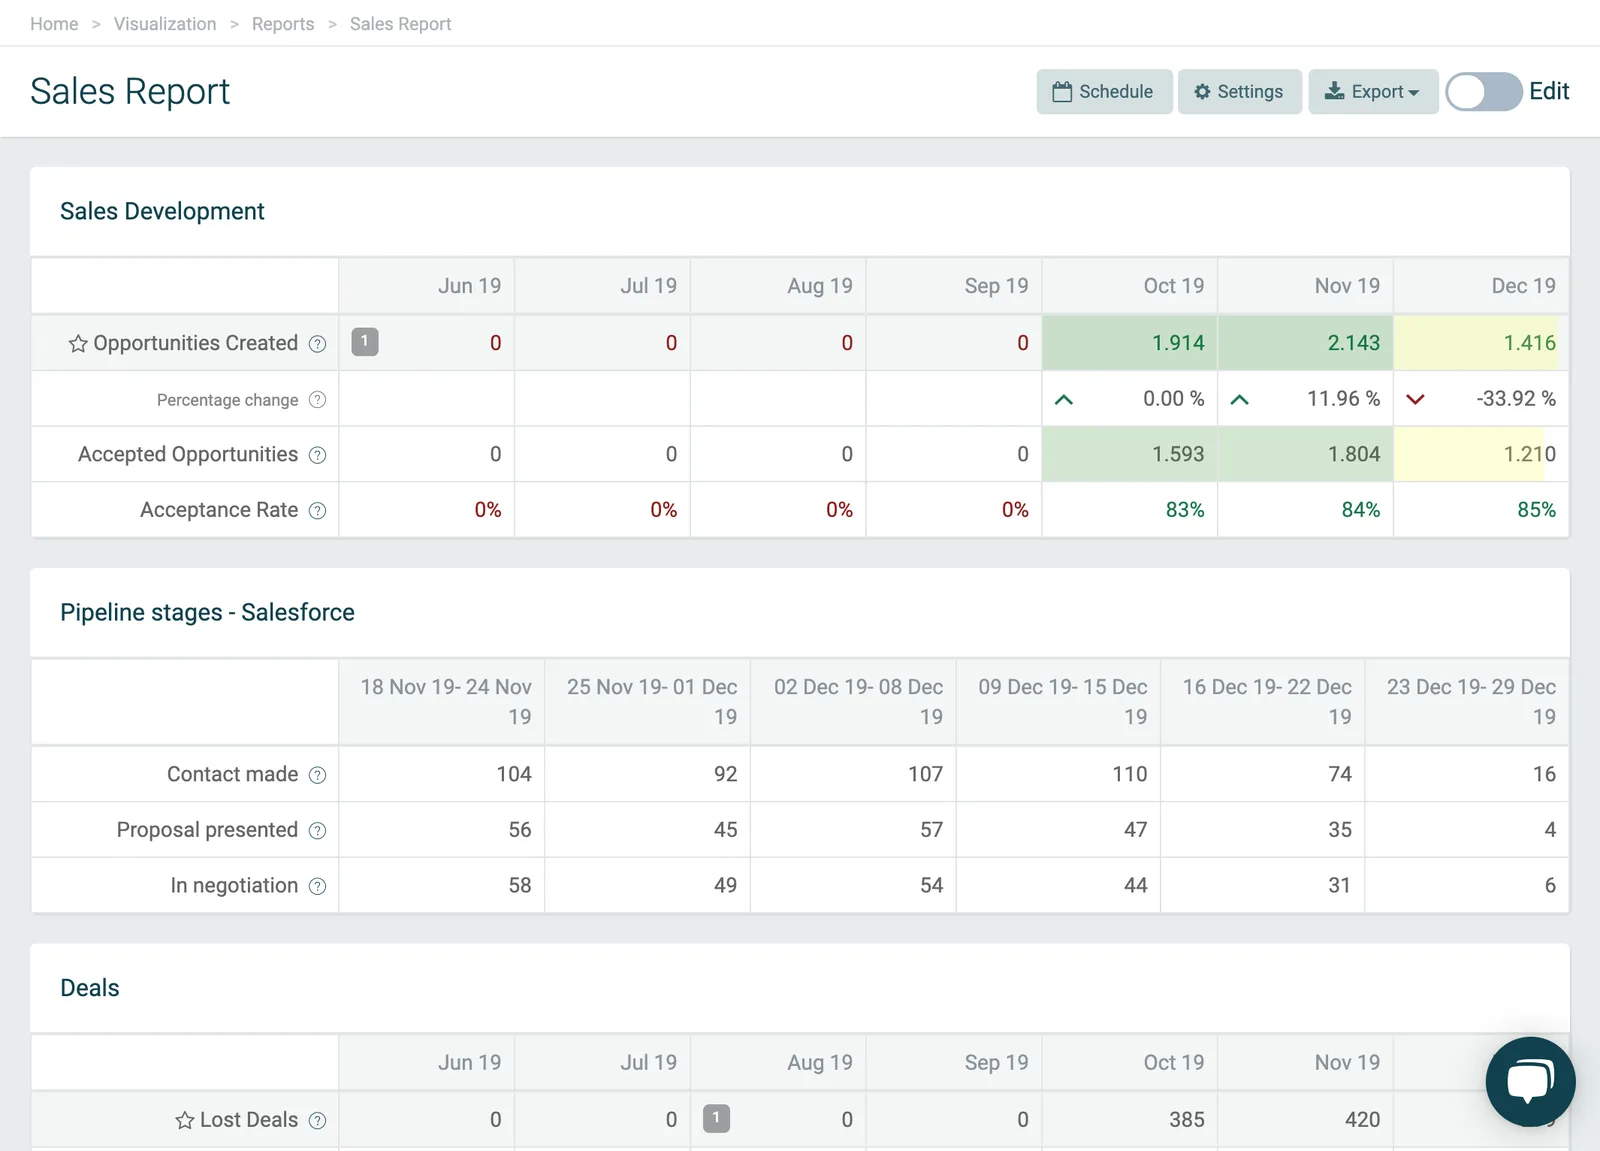
This Sales Report shows Sales Development rows by month (opportunities created, percentage change, accepted opportunities and acceptance rate), a Pipeline stages table by week (contact made, proposal presented, in negotiation) and a Deals section. Reports can be scheduled to land in your inbox, or your colleagues' inboxes, at a time you choose. Reports are on the Large and Enterprise plans; see reports in Plecto.
Show your Salesforce dashboard on a TV
Salesforce holds your data, but a team only acts on what it sees. Plecto dashboards run on an unlimited number of TVs at no extra cost, through slideshows, the Plecto TV app or the browser on any TV. They also work on mobile.
Add the dashboard, a leaderboard or a contest to a slideshow, open tv.plecto.com on the TV to get a four-digit code, and enter it under Slideshows > Actions > Activate. For the full walkthrough, read how to create a TV dashboard for Salesforce and our TV dashboards guide.
How to build a Salesforce dashboard in Plecto
- Connect Salesforce. Go to Data sources > New data source > Salesforce, sign in and click Allow. To connect a Sandbox account, enable the Connect to a Salesforce Sandbox option. The Salesforce integration guide lists every step.
- Import your objects. Plecto can import almost anything in Salesforce that has a created or modified date field, including opportunities, leads, tasks, custom objects and objects from AppExchange apps.
- Create your KPIs. Go to Formulas > New formula. For example, count opportunities with the stage Closed Won by close date, as in the 10 KPIs for Salesforce. You can also start from the ready-made Salesforce template in the Plecto Store.
- Build the dashboard. Add widgets under Dashboards: gauges against a target, a leaderboard, a table per employee, and conditional colors.
- Add a contest or notification. Start a sales contest, or create a notification under Notifications > New notification for new deals.
- Put it on a TV. Add the dashboard to a slideshow and activate it on an office screen.
Start with the Salesforce integration page, or try it yourself: Plecto has a 14-day free trial with no credit card required.
Salesforce dashboard FAQ
A Salesforce dashboard is a visual summary of your Salesforce data, such as opportunities, leads and tasks, shown as KPIs, charts and tables. Salesforce includes its own dashboards for analysis inside the CRM, and tools like Plecto show the same data live on TVs and phones with targets and leaderboards.
It depends on the job. Native Salesforce reports and dashboards, with CRM Analytics or Tableau as upgrades, suit analysis inside the CRM. BI tools such as Power BI suit modelling Salesforce together with finance or ERP data. Plecto fits when you want a real-time Salesforce KPI dashboard on TVs and phones, with targets, leaderboards, contests and other systems next to Salesforce. See the full comparison.
A Plecto Salesforce dashboard updates every 2 minutes, which is the update frequency of the Salesforce data source. Salesforce Chat is the exception and is streamed live, so queues and longest wait show in real time.
Yes. Plecto has 150+ integrations, so you can show Salesforce pipeline next to calls from a phone system such as Aircall or tickets from a helpdesk on one dashboard. See all integrations.
You can import almost any Salesforce object that has a created or modified date field, including opportunities, leads, tasks, events, custom objects and objects from AppExchange apps. A Salesforce Sandbox can be connected too.
Yes. Add the dashboard to a Plecto slideshow and play it on office TVs through the Plecto TV app or the TV's browser. Plecto TVs are free on all plans. Follow the Salesforce TV dashboard tutorial.
No. Plecto is not a BI warehouse and does not model data across a whole company. Keep Salesforce reports, CRM Analytics, Tableau or Power BI for analysis, and use Plecto for the live Salesforce KPIs, targets and contests the team sees every day.
Plecto is priced per license per month with a 10-license minimum. Medium is USD 30 and Large is USD 46.50 per license per month billed monthly, and billing yearly takes 20% off. Enterprise is custom. Every plan has unlimited dashboards, data sources and TVs, and there is a 14-day free trial with no credit card required. See pricing.