 Sign in

HubSpot dashboard examples: sales and marketing KPIs in real time
Plecto turns HubSpot deals, calls, meetings, emails and tickets into live dashboards, leaderboards and contests that your team sees on TVs and phones.
What is a HubSpot dashboard?
A HubSpot dashboard is a live view of the numbers your team is measured on, built from HubSpot records such as deals, calls, meetings, emails and tickets. HubSpot has its own dashboards inside the CRM. Plecto adds a real-time HubSpot dashboard for TVs and phones, with targets, leaderboards and contests, so reps see their own performance without opening a report.
The examples below show what teams build in Plecto, and the rest of the page covers which KPIs to use, how native HubSpot dashboards compare, and how to set one up.
HubSpot sales dashboard example: won deals and win rate
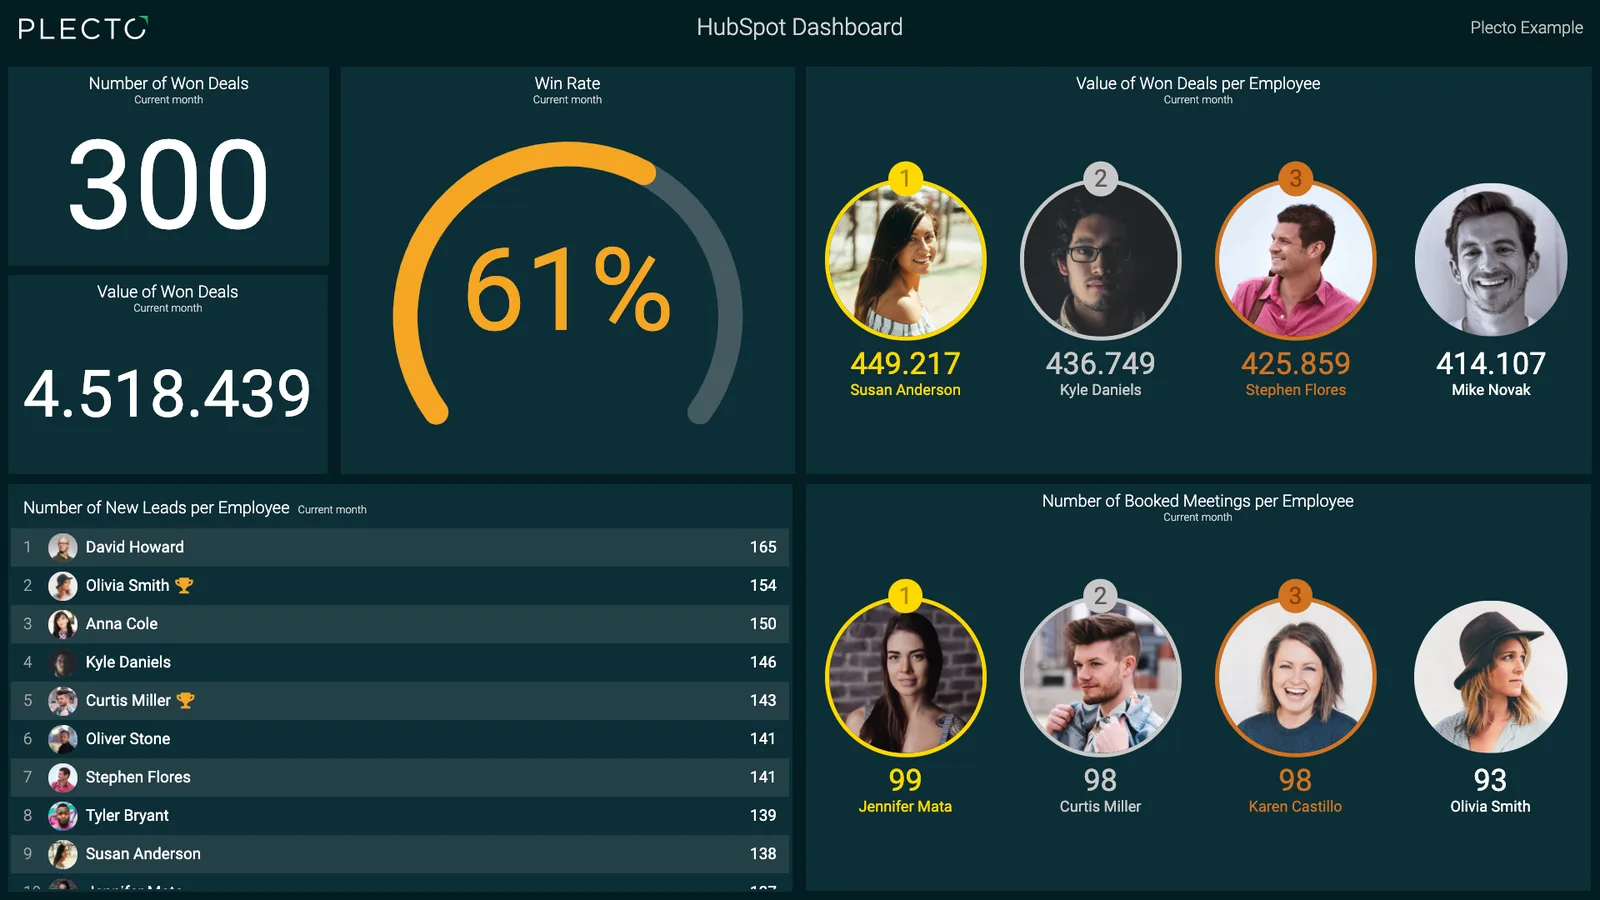
This HubSpot sales dashboard shows the pipeline results on the left and the people behind them on the right. At the top it shows the number of won deals (300), the value of won deals (4,518,439) and a win rate of 61% on a gauge. Below, you can see the value of won deals per employee with each rep's photo, a table of new leads per employee, and booked meetings per employee.
Everything is matched to the rep through the HubSpot owner field, so each person finds their own line on the screen. A rep who has just closed a deal sees the number move, because HubSpot deals arrive instantly through webhooks. See the KPIs behind this view in number of won deals, win rate of deals, number of new leads and number of booked meetings.
Explore Plecto sales dashboardsHubSpot marketing dashboard example: marketing emails
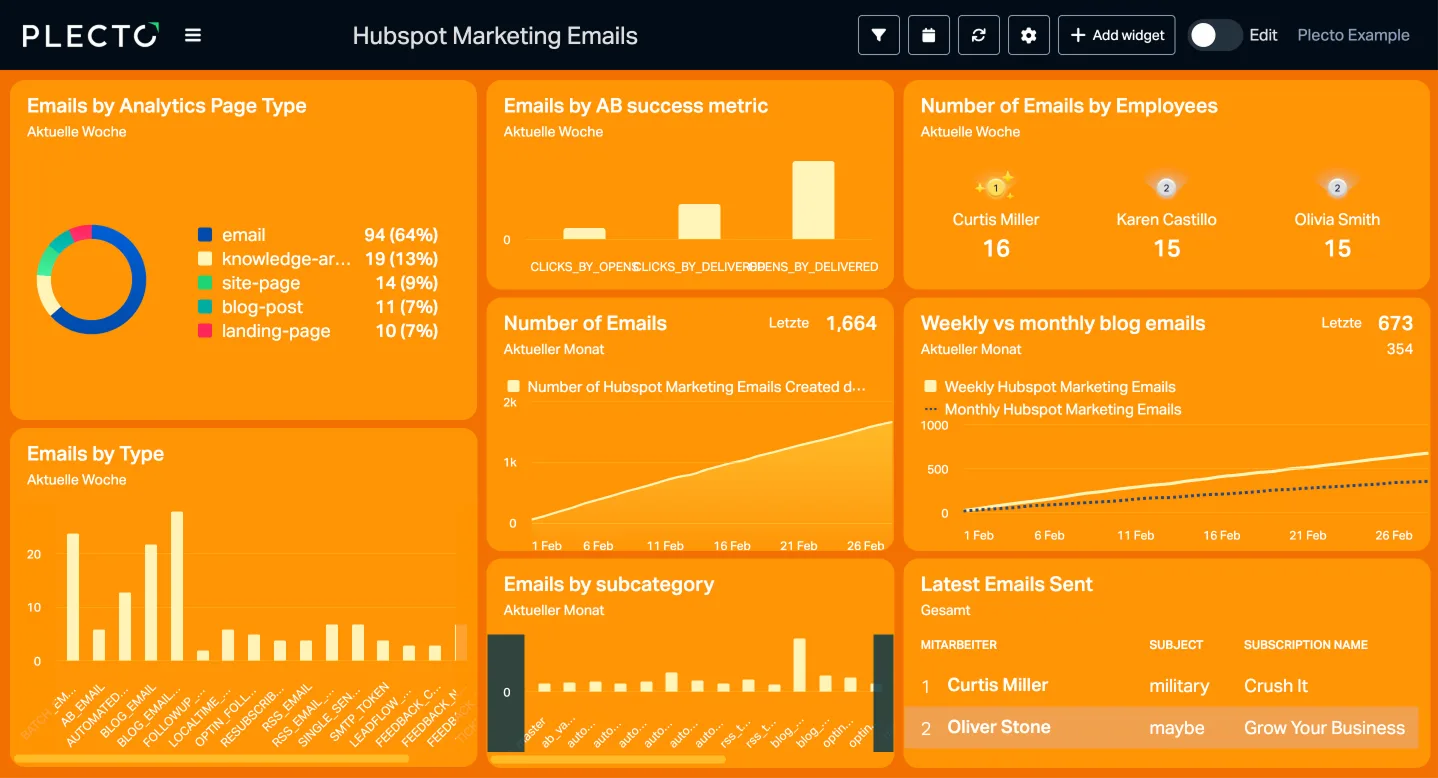
Marketing teams use the same approach with the HubSpot Marketing Emails data type. This orange HubSpot marketing dashboard shows emails by analytics page type in a donut chart, emails by A/B success metric, the number of emails and the number of emails per employee. It also compares weekly and monthly blog emails as a trend, breaks emails down by type and subcategory, and ends with a table of the latest emails sent.
The dashboard tells the team what was published and by whom. If you want performance numbers next to it, check which fields your HubSpot account sends before you build the formula.
HubSpot dashboard example: a won deals contest
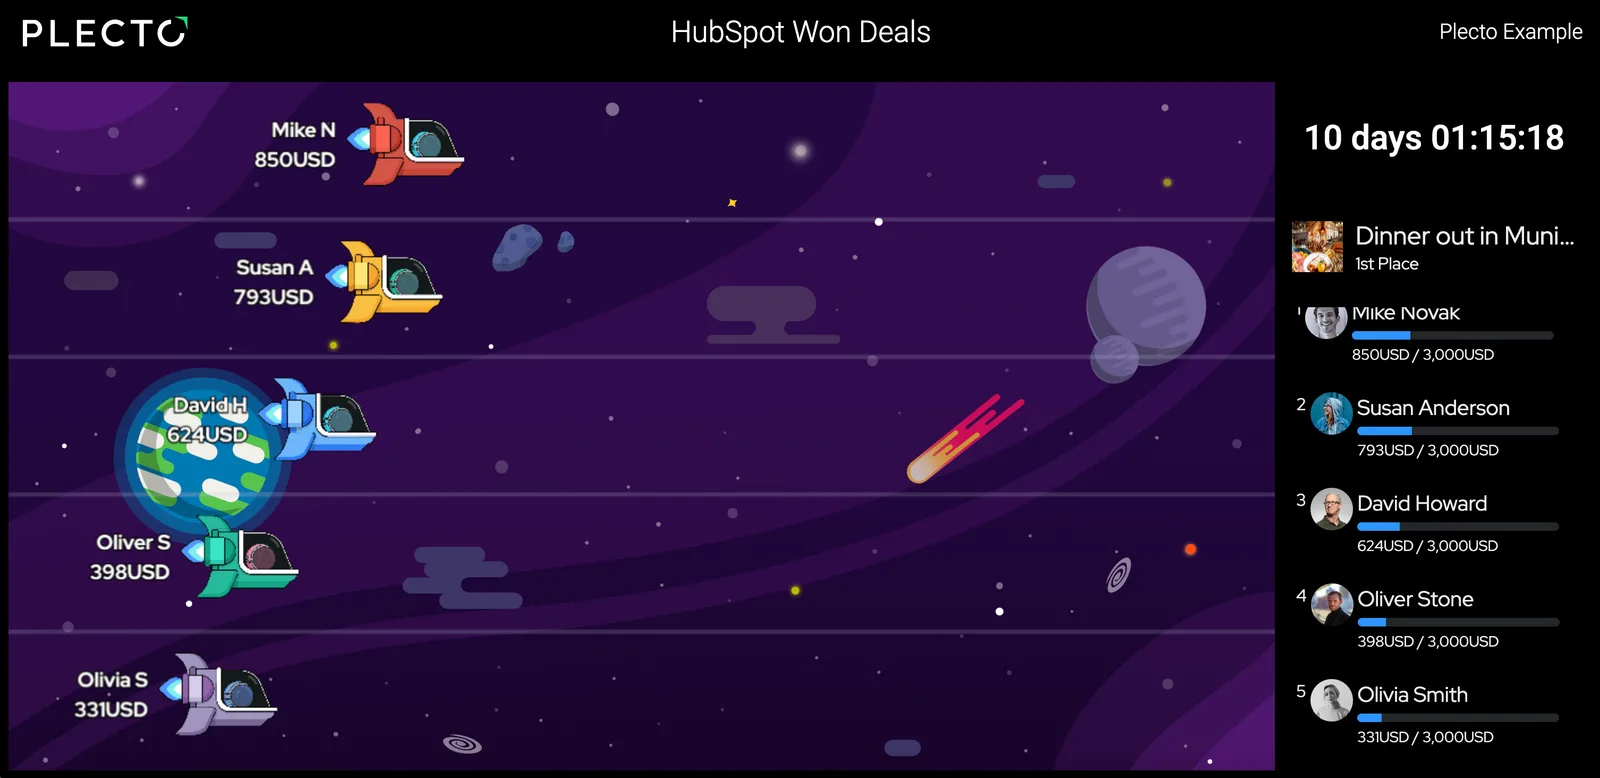
A dashboard shows what happened. A contest gives reps a reason to look at it. This HubSpot won deals contest has a space theme: each rep is a rocket, positioned by the value of the deals they have won in USD, with a countdown to the end of the contest and a list of prizes.
Contests are built on the same HubSpot KPIs as your dashboard and run on every TV in the office. They are available on the Large and Enterprise plans. Read more about gamification in Plecto and sales contests.
Which KPIs belong on a HubSpot KPI dashboard?
Start with five to eight numbers per team. These are the ones HubSpot data supports well.
Sales KPIs
Track win rate of deals, average deal size, weighted pipeline value and average sales cycle length. Per rep, add booked meetings, calls and number of lost deals.
Marketing KPIs
Follow number of new leads, number of emails sent and your sales conversion rate. Marketing emails and campaigns are importable HubSpot data types.
Service KPIs
If you use HubSpot Service Hub, put ticket backlog, first response time and customer satisfaction (CSAT) on the same screen as sales.
Plecto's HubSpot integration includes pre-built HubSpot KPIs you can start from, and you can write your own formulas when your process is different. Our article on the 10 essential KPIs for HubSpot users explains how to set up the most common ones.
HubSpot performance tracking: design a dashboard people actually use
A HubSpot dashboard only changes behavior if the team reads it. These habits help, whichever tool you build it in:
- Keep it to a handful of numbers. Five to eight KPIs per team are easier to read from across a room than thirty. Put the result KPI, such as won deal value, next to the activity KPIs that drive it, such as calls and booked meetings.
- Show every rep against a target. A total tells a rep little. A number next to a target, with conditional colors for on track, close and behind, tells them what to do next.
- Use one owner definition. HubSpot activity is matched to people through the owner field, so check that deals, calls and meetings are assigned consistently before you rank anyone.
- Celebrate in the moment. A notification can announce a won deal on the slideshow, so a closed deal is seen by the whole floor. Notifications are on every plan.
- Use the data in coaching. Managers can open a rep's numbers in a one-on-one instead of collecting them by hand; one-on-ones are on the Large and Enterprise plans. Read more about coaching and training in Plecto.
If you need other layouts, browse the sales dashboard examples and the sales activities dashboard for more layouts to adapt to your HubSpot data.
Native HubSpot dashboards vs a real-time HubSpot dashboard in Plecto
HubSpot's own reports and dashboards are the right choice when the people who need the numbers already work in HubSpot. The custom report builder needs a Professional or Enterprise subscription. HubSpot's help says custom reports refresh automatically every two hours and can be refreshed manually once every 15 minutes, so check how a wall-mounted screen would stay current.
Plecto fits when you want the numbers on the floor and attached to people:
- Refresh: HubSpot deals arrive instantly through webhooks, and calls, meetings, emails, tasks and tickets update every 2 minutes.
- TV and mobile: dashboards run on TVs, desktops and phones. TVs are free on all plans.
- Gamification: leaderboards, badges, notifications and, on Large and Enterprise, contests and the Reward Store.
- More than HubSpot: unlimited data sources on every plan, so you can put calls from a phone system such as Aircall or tickets from Zendesk Support next to HubSpot deals.
Plecto is not a BI warehouse. It shows the HubSpot data you import and does not replace Power BI for modeling data across a company. Many teams keep HubSpot as the system of record and use Plecto as the live layer on top. See Reports in Plecto vs HubSpot for a feature-by-feature comparison.
Tracking sales team performance with HubSpot CRM data
Which performance tracking tool works best with HubSpot CRM data?
It depends on who looks at the numbers. The best performance tracking tool for HubSpot CRM data is the one that links each record to a person and a target.
- HubSpot's own reporting fits analysis inside the CRM for people who are already logged in.
- Databox or Klipfolio fit custom metrics across several marketing and business tools, when an hourly or plan-based refresh is enough.
- Power BI fits modeled analysis across the whole company, usually with a third-party connector or data warehouse in between.
- Plecto fits live per-rep performance tracking on TVs and phones, with targets, leaderboards, contests, notifications and one-on-ones. Contests and one-on-ones are on the Large and Enterprise plans.
For a table of eight options with refresh speeds, read our comparison of HubSpot dashboard tools. To rank reps, start with a sales leaderboard and read how Plecto helps you gamify HubSpot.
Show your HubSpot dashboard on an office TV
Put the dashboard in a slideshow and open it on any TV. Each TV is free to add on all plans, and you can mix the HubSpot dashboard with leaderboards and other KPI dashboards in the same rotation. The step-by-step tutorial is in how to create a TV dashboard for HubSpot, and the TV dashboards guide covers TV apps and browsers.
See how to activate slideshows on TVsHow to build a HubSpot dashboard in Plecto
- Connect HubSpot. Go to Data sources > New data source > HubSpot, log in and click Grant access.
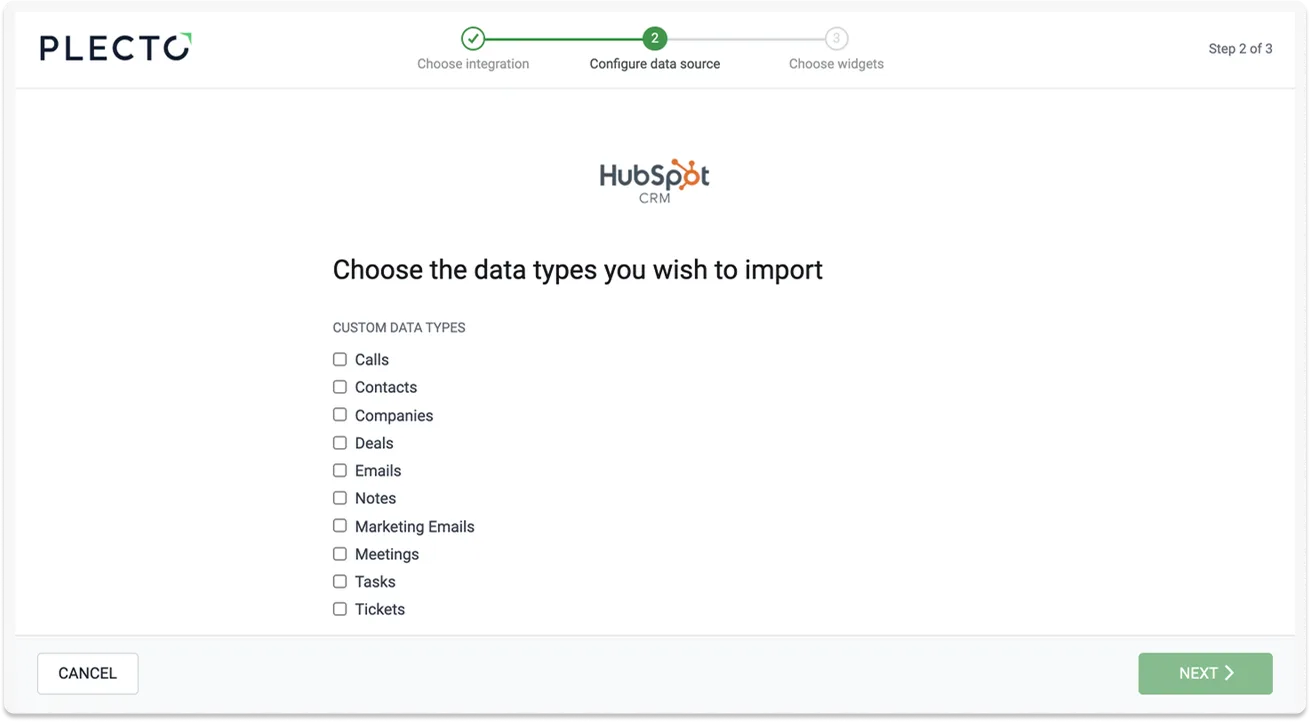
- Choose the data types. Pick what your team is measured on, such as calls, contacts, companies, deals, emails, marketing emails, meetings, notes, tasks and tickets. The HubSpot integration guide lists every data type and its refresh rate.
- Create the KPIs. Start from a pre-built HubSpot KPI, or go to Formulas > New formula and write your own, for example won deal value this month.
- Add widgets. In Dashboards, add KPIs, leaderboards and charts, and set targets and conditional colors.
- Show it on a TV. Add the dashboard to a slideshow under Slideshows and activate it on a TV.
Plecto offers a 14-day free trial with no credit card required.
HubSpot dashboard FAQ
A HubSpot dashboard is a collection of reports and KPIs built from your HubSpot data, such as deals, calls, meetings, emails and tickets. HubSpot has dashboards of its own, and tools like Plecto build live HubSpot dashboards for TVs and phones with targets, leaderboards and contests. See the HubSpot integration for details.
HubSpot deals arrive instantly through webhooks, with a check every 2 minutes as a backup. Calls, meetings, emails, tasks, notes and tickets update every 2 minutes, and contacts and companies use webhooks with a full check every 15 minutes. The HubSpot integration guide has the full list.
You can import deals, calls, meetings, emails, marketing emails, tasks, notes, tickets, contacts, companies, forms and custom data types, among others. Deals, calls, meetings, emails, tasks and tickets are matched to each rep through the HubSpot owner field. The integration page lists every type.
It depends on who needs the numbers. HubSpot's own reporting suits analysis inside the CRM, Databox and Klipfolio suit custom metrics across several tools, and Power BI suits company-wide BI modeling. Plecto suits live per-rep performance tracking on TVs and phones with targets, leaderboards and contests. Compare them in our HubSpot dashboard tools guide.
Yes. Plecto has 150+ integrations and unlimited data sources on every plan, so you can show HubSpot deals next to calls from Aircall or tickets from Zendesk Support. Each source refreshes at its own rate.
Yes, on the Large and Enterprise plans. Turn won deals, deal value or booked meetings into an individual or team contest with a target and an end date, and show it on a TV. Read more about contests.
HubSpot's dashboards describe what happened in HubSpot. Plecto adds live TV and mobile dashboards, targets, native gamification and the option to combine HubSpot with other systems. It does not replace HubSpot or a BI warehouse. See Reports in Plecto vs HubSpot.
Plecto is priced per license per month with a 10-license minimum. Medium is USD 30 and Large is USD 46.50 per license per month billed monthly, and billing yearly takes 20% off. Enterprise is custom. Every plan has unlimited dashboards, data sources and TVs, and there is a 14-day free trial with no credit card required. See pricing.