 Sign in

Business Dashboard
Business dashboard software: live KPIs for every team
Plecto is business dashboard software. It pulls data from your CRM, phone system, helpdesk and finance tools, colors every KPI against its target, and shows it on desktops, mobile and office TVs.
What is a business dashboard?
A business dashboard is a single screen that shows the most important KPIs of a company, a department or a team, updated from the underlying systems so that people can see how the business is doing and act on it. A good business dashboard compares each number with a target, so that it is clear at a glance what is on track and what is not.
For the theory behind the term, read our guide to business dashboards: definition, types and benefits. This page is about what they look like in practice and how to build one.
Business dashboard examples: one view for every department
A department overview on one screen
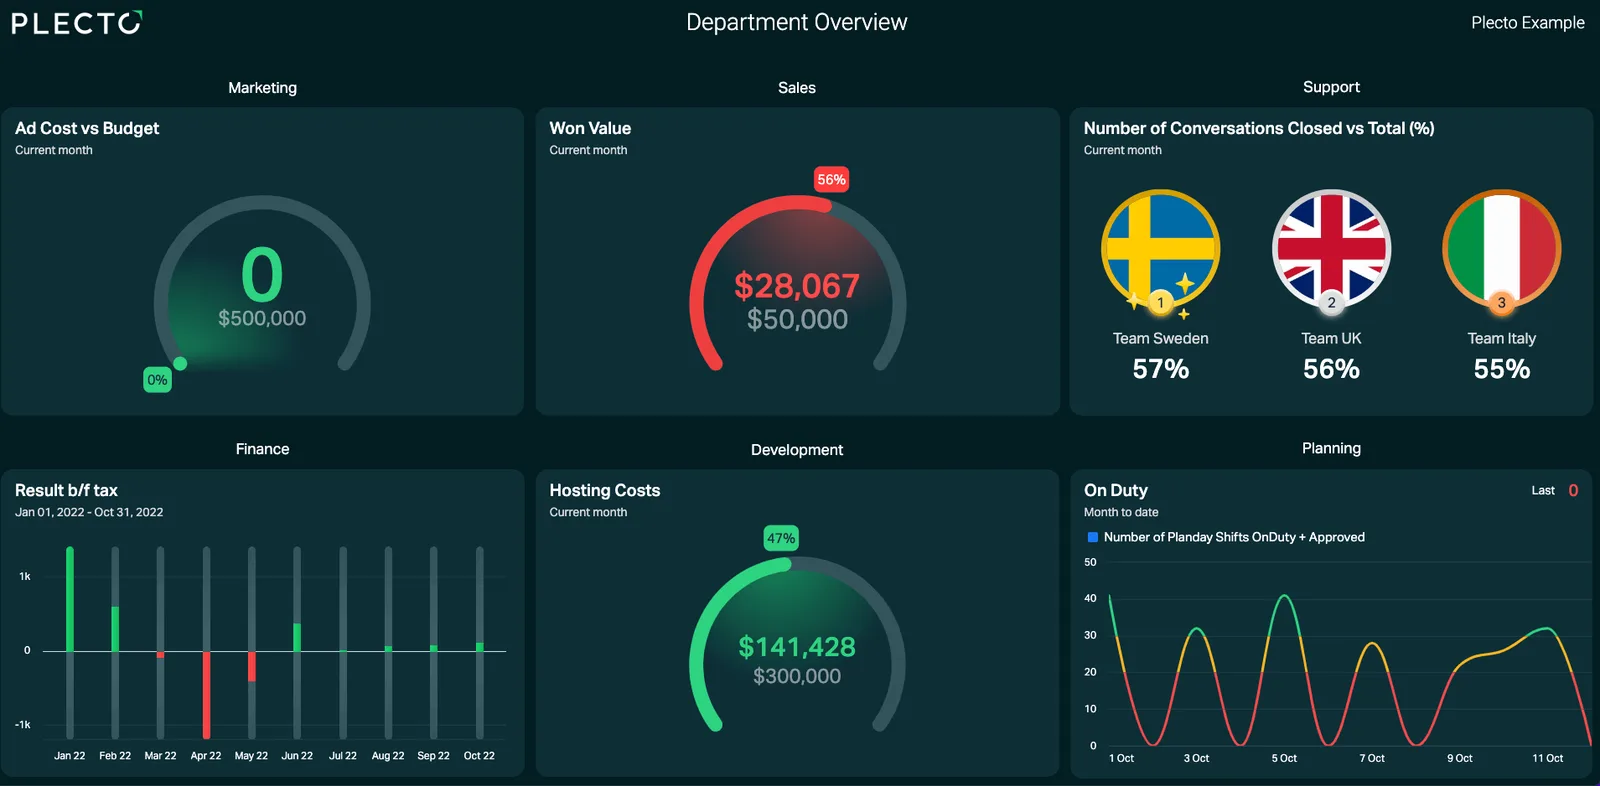
The dashboard in the image shows the idea. Each department gets its own group of widgets: ad cost against budget for Marketing, won value against a target for Sales, conversations closed by team for Support, result before tax for Finance, hosting costs against budget for Development and who is on duty for Planning.
Why this works as a business dashboard example
Every department has one or two numbers that matter, and every number is shown against a goal. Leadership gets the company picture, and each team still recognizes its own KPIs. Plecto has unlimited dashboards on every plan, so you can start with an overview and add a dashboard per team later.
Browse more dashboard examplesSales and customer service business dashboard examples
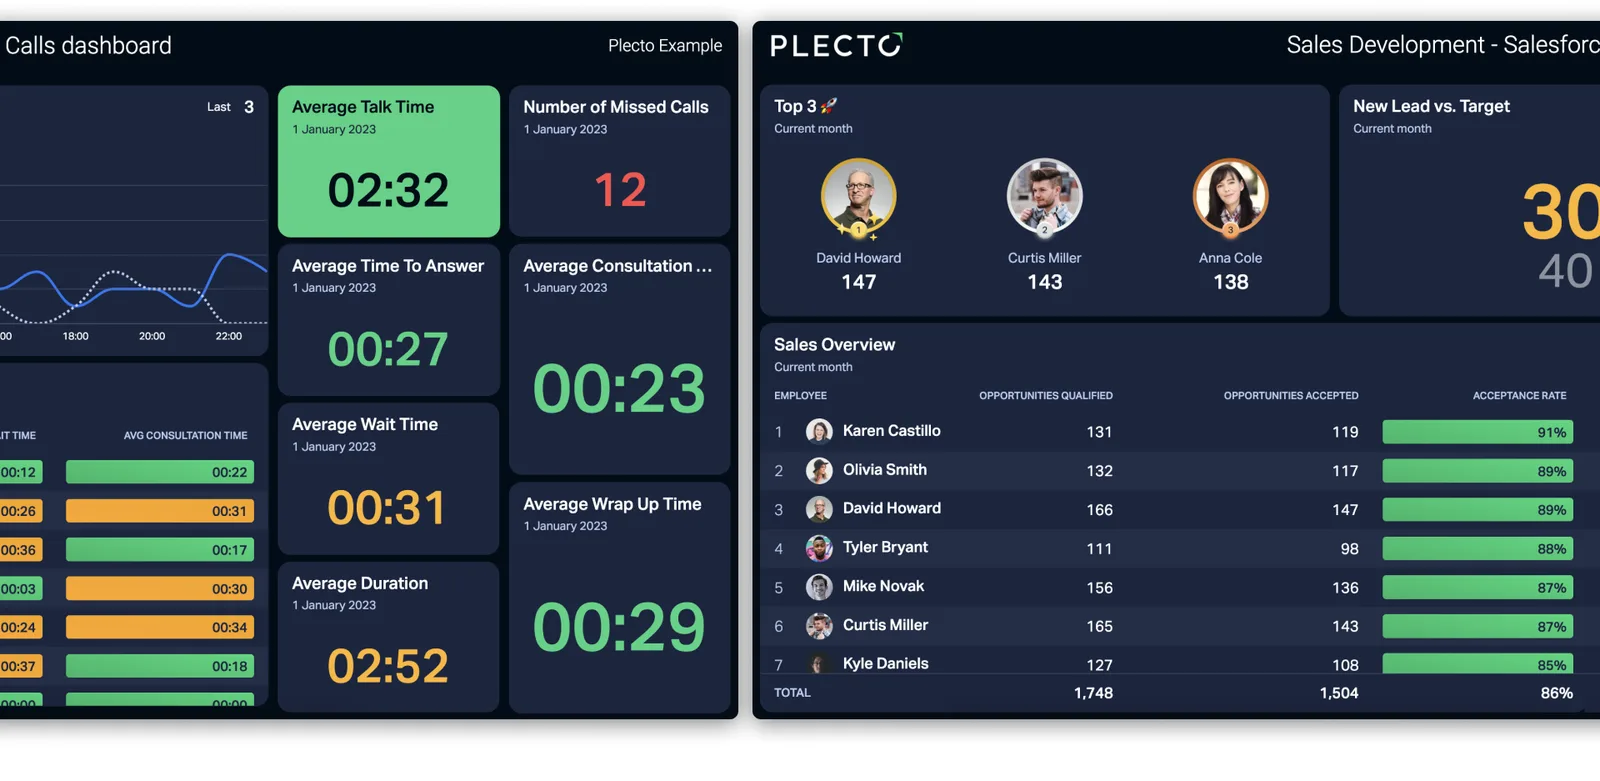
The two dashboards in the image sit side by side. On the left is a calls dashboard with average talk time, number of missed calls, average time to answer, average wait time and average wrap-up time. On the right is a Sales Development dashboard built on Salesforce data, with the top three reps, new leads against target and a sales overview table.
Putting a sales view and a service view next to each other is useful when one team hands work to the other, or when a manager needs both. See sales dashboards and the customer service dashboard pages for more of each.
A finance business dashboard from Business Central
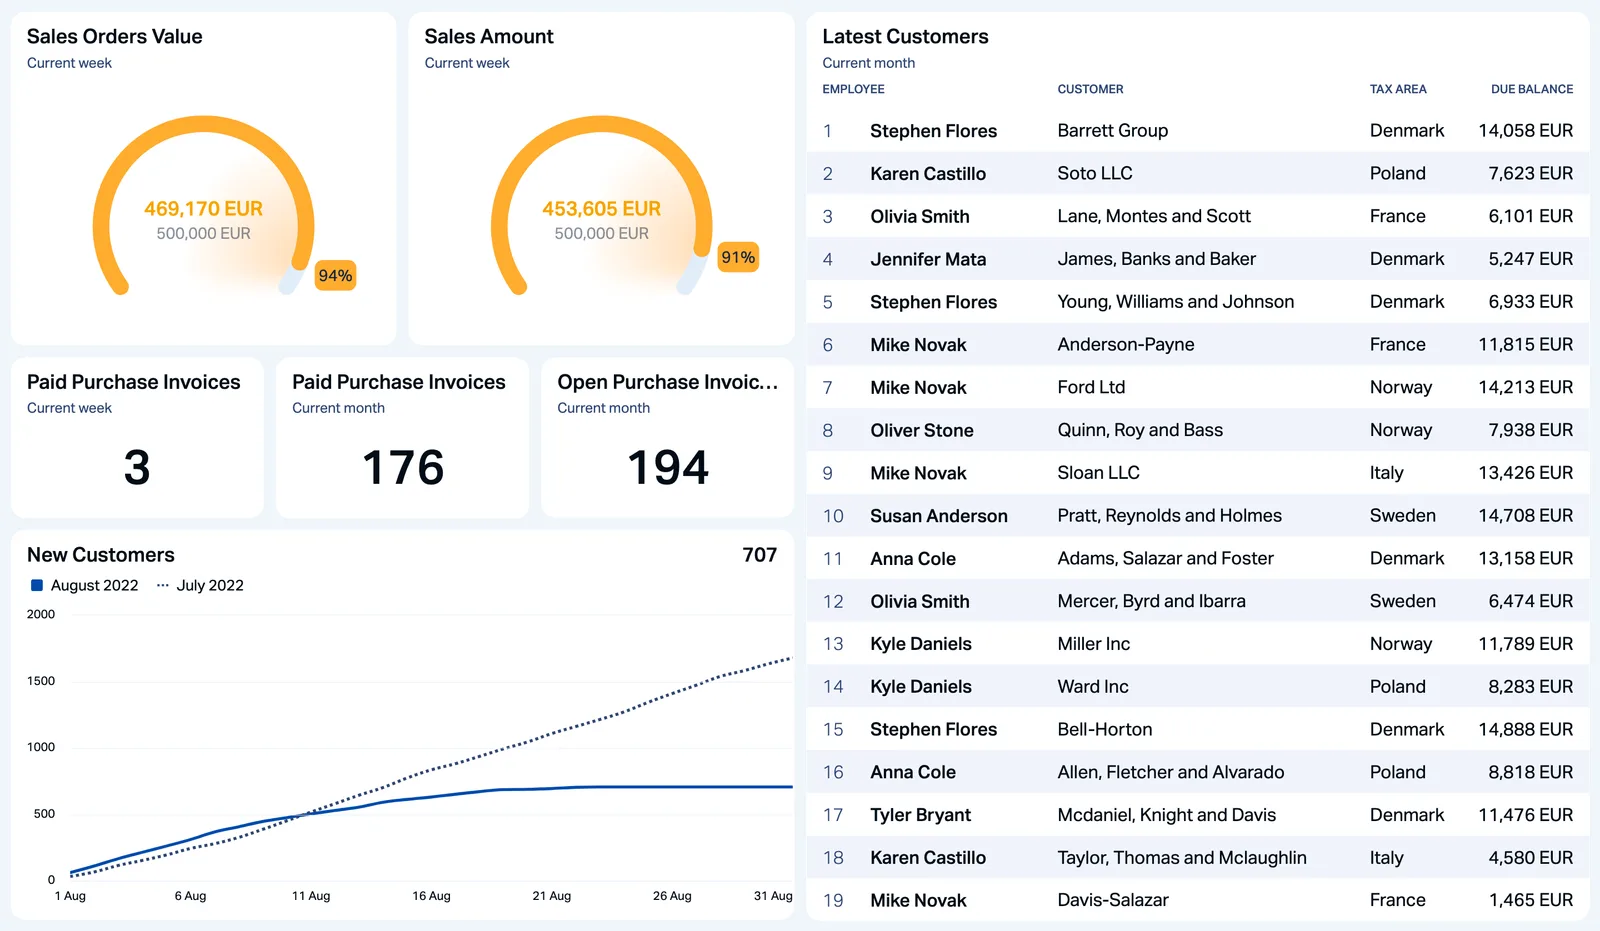
Finance data belongs on a business dashboard too. This example reads Dynamics 365 Business Central and shows sales orders value and sales amount as gauges in EUR, paid and open purchase invoices, a trend line of new customers and a table of the latest customers by country.
The Business Central integration covers accounting, sales, purchasing, inventory and customer transactions. For more on what finance teams track, see finance dashboards.
Types of business dashboards
Operational business dashboards
Operational dashboards show what is happening now: calls waiting, deals won today, open tickets. Teams use them to react during the day, and they are usually shown on a TV or desktop.
Strategic and executive dashboards
Strategic dashboards give leadership a company-wide view of revenue, customer satisfaction and growth. Read more about the executive dashboard and the management dashboard.
Analytical business dashboards
Analytical dashboards are for exploring data in depth, usually by analysts in a BI tool. Plecto is not a BI warehouse. It is built for live KPIs, targets and team performance, and sits next to a BI tool if you need deep analysis.
Which KPIs belong on a business dashboard?
Choose the few KPIs each team can influence, and give each one a target. Browse the full KPI library for definitions and formulas. These are common starting points by department:
Marketing
Cost per lead, return on ad spend and total ad spend, as in the Marketing group of the department overview above.
Performance dashboards: track people and teams against targets
A performance dashboard is a business dashboard that focuses on how people and teams are doing against their goals. Plecto adds the parts that turn a screen of numbers into something a team reacts to.
Targets and conditional colors
Add conditional colors to a KPI so it is green on target, yellow when close and red when not. Everyone sees the status from across the room.
Leaderboards, notifications and gamification
Show a leaderboard of the top reps, and set a notification that fires when a KPI meets a condition, such as a won deal. Gamification adds contests, badges and the Reward Store. Contests and the Reward Store are on the Large and Enterprise plans, and notifications are on every plan.
Learn how Plecto gamification worksReal-time business dashboards on TV screens
A real-time KPI dashboard for TV screens only works if the whole team can see it. Put the dashboard in a slideshow and open it on any office TV, next to your leaderboards. TVs are free on every plan, and the same dashboards run on desktops and in the Plecto mobile apps. Most data sources update about every two minutes, and some phone systems stream faster.
For a comparison of Plecto, Geckoboard, Databox, Klipfolio, Hoopla, Power BI, Grafana and Yodeck for TV displays, read the TV dashboards guide. For the sales floor, see the digital sales board, and for phones, mobile dashboards.

Automated business dashboard reports
Dashboards are for the live view. For the monthly or weekly summary, Plecto reports reuse the same formulas and KPIs in a report format.
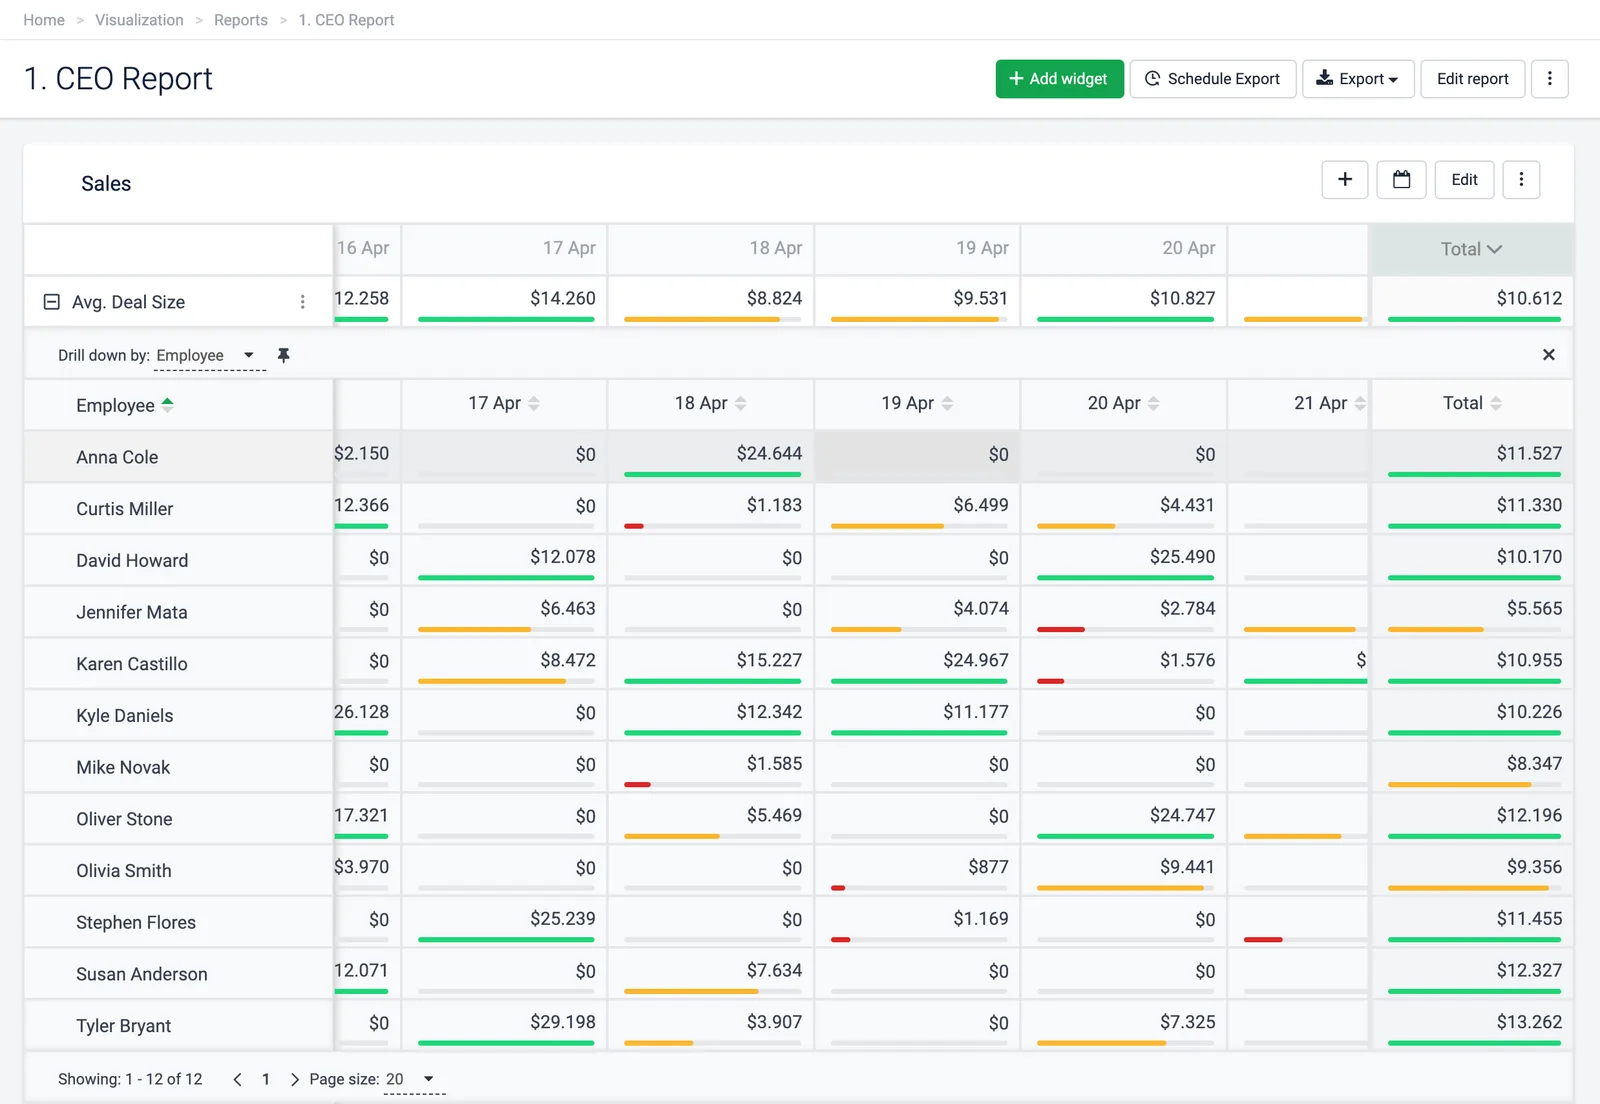
The CEO report in the image is a table of average deal size per employee by day, with colored target bars. From the report you can schedule delivery to your inbox or export it, including as a PowerPoint presentation. Reports are available on the Large and Enterprise plans.
What to look for in business dashboard software
Before you pick business dashboard software, check these points:
- Your data sources: the dashboard has to read your CRM, phone system, helpdesk and finance tools, or someone ends up typing numbers in. Check the integrations list for your exact tools.
- Refresh speed: a monthly finance view can be slow, but a sales floor or service desk wants minutes or faster.
- Your own KPIs: the ability to build custom formulas and targets, not only ready-made charts.
- Who can build it: a manager should be able to change a dashboard without a developer.
- Motivation, not just display: leaderboards, notifications and contests turn a wall of numbers into something people react to.
- Screens: whether TVs, desktops and mobile are all included, and what extra screens cost.
To compare tools side by side, read our guide to the best dashboard software, or see how Plecto works as KPI dashboard software for sales and support teams.
How to build a business dashboard in Plecto
- Connect your data. Go to Data sources > New data source and choose your tools, from a CRM such as Salesforce to a phone system, helpdesk or finance system. Plecto has 150+ integrations, and the REST API and spreadsheets cover the rest. See all integrations.
- Define your KPIs. Go to Formulas > New formula to build the numbers you want, such as won value, average wait time or open invoices. Add targets and conditional colors.
- Build the dashboard. Go to Dashboards, create a dashboard per team or one overview, and add the KPIs as widgets such as gauges, number boxes, tables and charts.
- Add notifications. Go to Notifications > New notification to trigger a message when a KPI meets a condition.
- Show it on a TV. Add the dashboards to a slideshow under Slideshows and activate it on an office TV.
Plecto offers a 14-day free trial with no credit card required. See pricing.
Business dashboard FAQ
A business dashboard is a screen that shows the KPIs a company, department or team needs to track, drawn from the systems where the data lives and compared with targets. It lets people see performance while the day is running instead of waiting for a report. For the longer explanation, read our business dashboards guide.
A performance dashboard is a business dashboard that tracks how people and teams are doing against their targets, usually with leaderboards and conditional colors. In Plecto it can be combined with notifications and gamification such as contests, which are on the Large and Enterprise plans.
It depends on the screen. Geckoboard fits a simple KPI screen for a small team, and Grafana fits engineering and database data. Power BI or Tableau fit BI analysis of modeled data. Plecto fits a live team KPI dashboard on TVs with targets, leaderboards and notifications from CRM, phone and helpdesk data, and TVs are free on every plan. Our TV dashboard software comparison covers each of them.
Salesforce has its own dashboards and CRM Analytics, and Tableau and Power BI can analyze Salesforce data in depth. Plecto has a built-in Salesforce integration and fits real-time team dashboards and TVs with leaderboards. See the Salesforce dashboard tools comparison and a Salesforce dashboard example.
Business dashboard software is usually priced per user or per plan. Plecto is priced per license per month with a 10-license minimum: Medium is USD 30 and Large is USD 46.50 billed monthly, and billing yearly takes 20% off. Enterprise is custom. Every plan has unlimited dashboards, data sources and TVs, and there is a 14-day free trial with no credit card. See pricing.
Not always. If your data lives in tools such as a CRM, phone system or helpdesk, Plecto connects to them directly and you do not need a data warehouse. Plecto is not a BI warehouse, so for deep ad-hoc analysis across modeled data, a BI tool such as Power BI or Tableau fits better, and the two can be used side by side.