 Sign in

CRM Data Visualization Tools: How Visual Dashboards Fix Adoption
Compare CRM data visualization tools and learn how live dashboards, TV screens and gamification get sales reps to keep the CRM up to date.
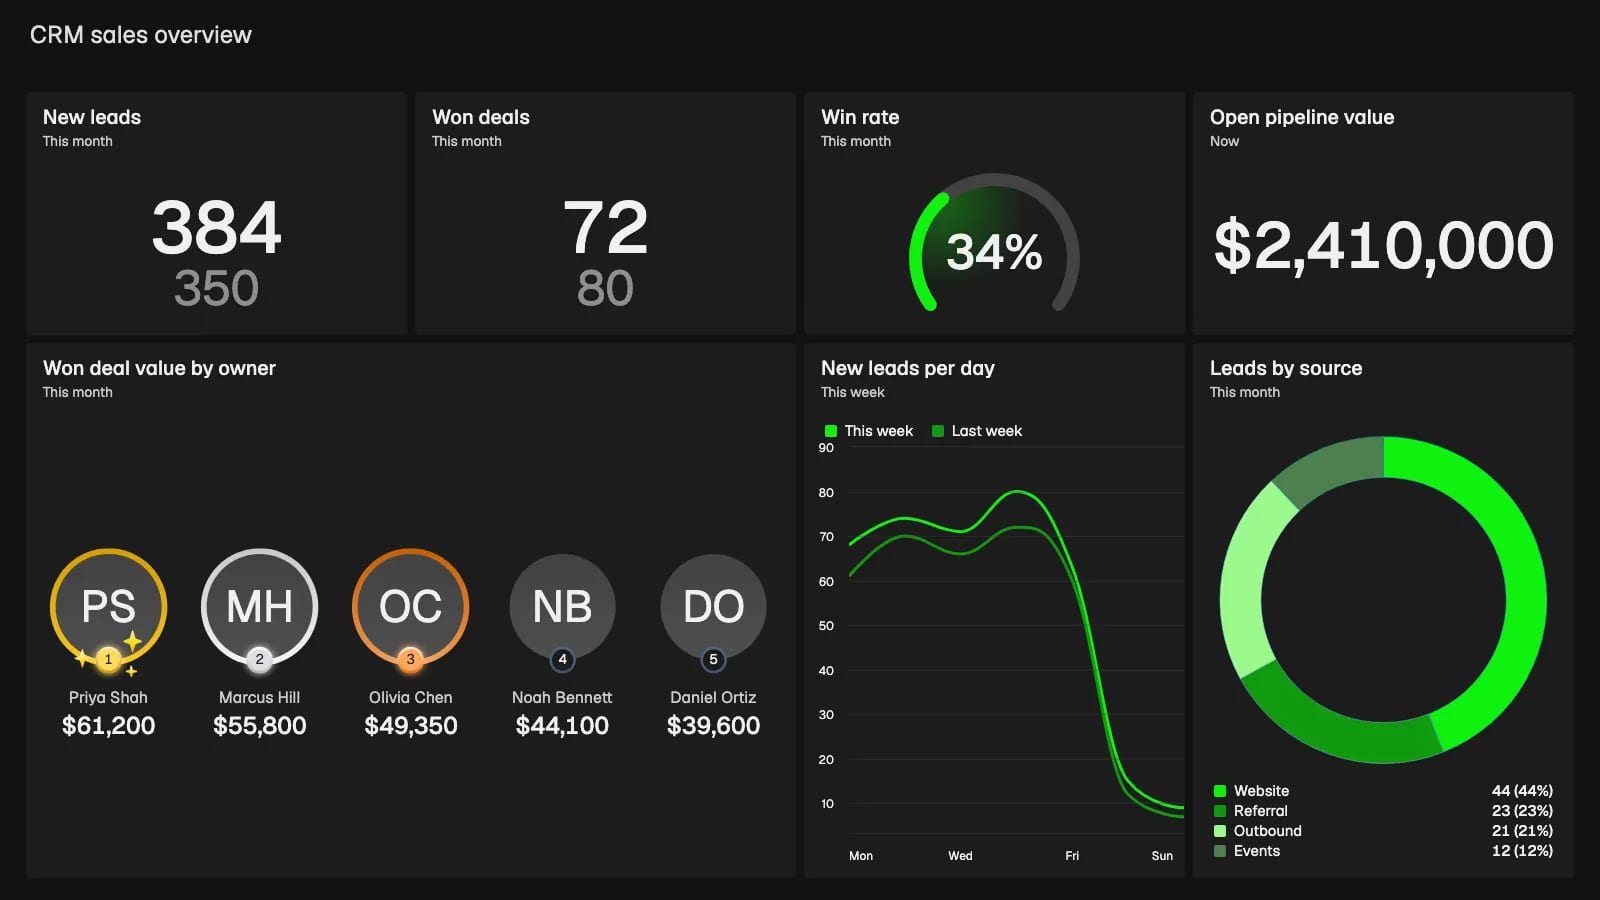
CRM data visualization tools exist because sales reps and managers rarely look at the same numbers at the same time. Reps log calls while managers check pipeline health, and that disconnect is why teams ignore the CRM. Reps dislike data entry because the software gives them nothing back right away. Managers need accurate forecasts, but they cannot get them while the team waits to update its deals. Visualization bridges the gap by turning hidden rows of data into visible, live metrics.
Why your team ignores your CRM (and how CRM data visualization tools fix adoption)
A CRM only works when the data inside it reflects reality. When sales teams see the CRM as a management surveillance tool, they update their records at the last possible minute. That creates a blind spot for leadership. You cannot forecast revenue accurately if Friday's closed deals do not appear in the system until Monday morning, a problem we cover in more depth in why your CRM should be your single source of truth.
Visual dashboards change this dynamic. When you show live metrics on office screens, data entry becomes a public activity. A rep who closes a deal wants the whole office to see it immediately. By connecting your CRM to live KPI dashboards, you give the sales team a reason to keep their records clean. The dashboard becomes the bridge between reps' daily actions and management's strategic oversight.

How CRM data visualization tools solve data fragmentation
Most companies do not keep all their operational data in one system. In a Databox survey, 73.13 percent of respondents named data spread across multiple sources as a reporting challenge. You might track sales in Salesforce, support tickets in Zendesk and project hours in Harvest. Forcing all of that into the CRM just for reporting rarely works.
Standalone business intelligence tools try to solve this by pulling data from every system into a central model, which brings its own syncing problems. CRMs cap how often you can call their APIs. HubSpot, for example, allows private apps 100 requests per 10 seconds and 250,000 per day on its Free and Starter plans. BI tools usually refresh on a schedule instead: Power BI Pro runs up to 8 scheduled refreshes per day, so the numbers on screen can be hours old.
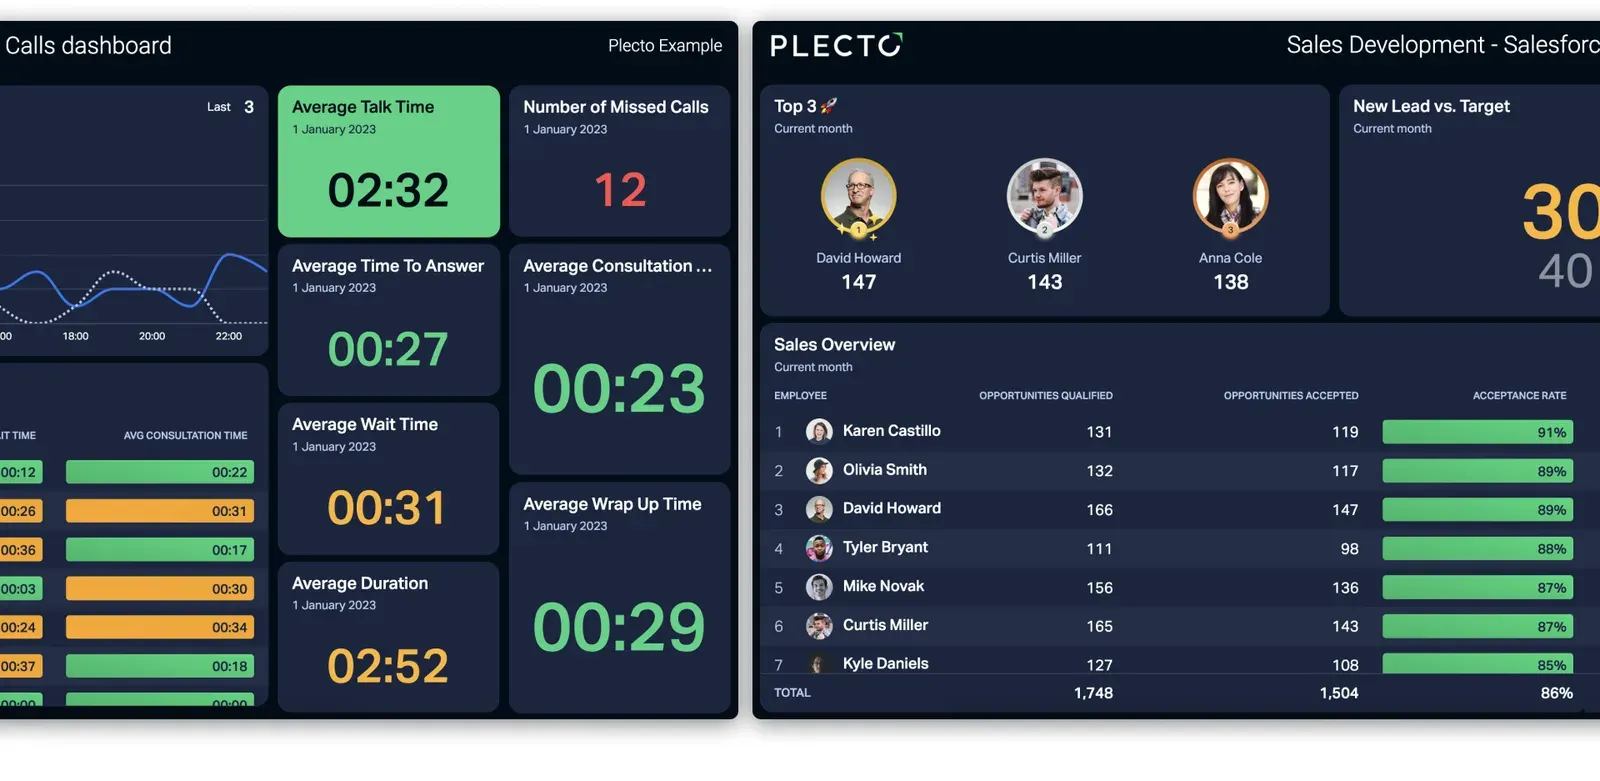
Dedicated performance dashboard platforms take a different route. Plecto connects to 150 business systems, including Salesforce, Pipedrive, Dixa and Zendesk Support. You can also import data through the API, SQL, Excel or manual entry. Plecto manages the connection and the update schedule for each source, so you can combine several systems in one live view without building a data pipeline.
Comparing the top CRM data visualization tools
The market offers several approaches to visualizing customer data. Some tools focus on deep analytical modeling, while others prioritize immediate visibility and team motivation.
| Platform | Starting price (list) | Primary focus |
|---|---|---|
| Salesforce CRM Analytics | $140 per user per month, billed annually | Predictive analytics inside Salesforce |
| HubSpot Sales Hub | Starter lists at $20 per seat per month; custom reports start on Professional | Native CRM reporting |
| Microsoft Power BI | Pro $14, Premium Per User $24 per user per month | Complex data modeling |
| Tableau | From $15 per user per month, billed annually | Visual-first data analysis |
| Plecto | 14-day free trial, then per-license pricing | Live performance dashboards and gamification |
Salesforce CRM Analytics targets enterprise revenue teams and costs $140 per user per month on an annual contract. Salesforce reports that CRM Analytics customers increase close rates by 28 percent, based on its 2024 success metrics survey of 830 customers. The price and the learning curve make it hard for smaller teams to roll out quickly. See how it compares with other Salesforce dashboard tools.
HubSpot builds reporting into the CRM itself, but custom report building starts on the Professional plan, not Starter. Our guide to HubSpot dashboard tools covers what each plan can show.
Microsoft Power BI costs $14 per user per month for Pro and $24 for Premium Per User. It handles large datasets well but needs specialist skills to build and maintain dashboards (Plecto vs. Power BI). Tableau starts at $15 per user per month for viewers, while building the views takes a pricier Creator license. It delivers excellent multi-dimensional visualizations but often needs a dedicated data analyst (Plecto vs. Tableau).
If your goal is to motivate your team and put metrics on office TVs, a platform like Plecto is the more direct route. You can connect your existing systems and build your first dashboard without writing SQL.
Essential features in CRM data visualization tools
Chart types to look for in CRM data visualization
A sales dashboard has to answer a few recurring questions fast: how many deals did we close, where do leads drop out, who is ahead and how are we trending against last month? Each question has a matching visual. Look for a tool that supports these formats natively:
- Number boxes and speedometers for instant status checks against a target
- Funnels to track conversion between pipeline stages
- Leaderboards to show who is ahead today, this week or this month
- Line, area and column charts to compare trends with the previous period
- Tables with conditional colors for rep-by-rep detail
Plecto covers all of these as dashboard widgets, along with donut charts, timelines and countdowns. You can browse ready-made layouts in our CRM dashboard examples.
Mobile-first CRM data visualization for field sales
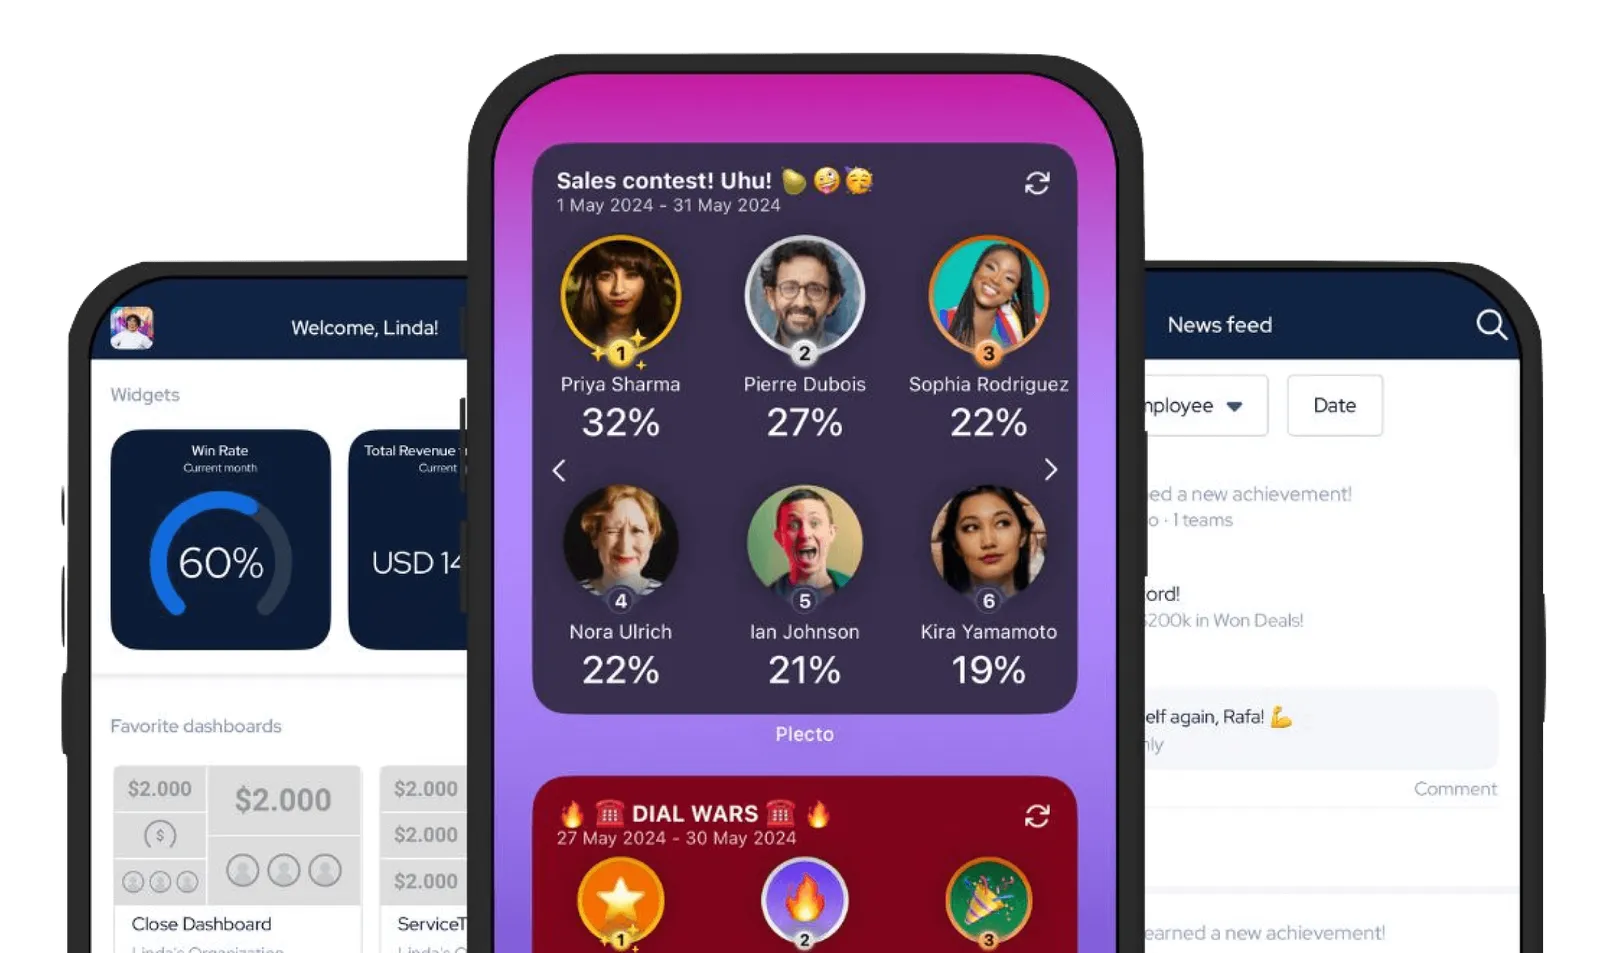
Field sales reps do not open laptops in their cars between client meetings. They rely on their phones, so the dashboard has to work on a small screen. Plecto's free mobile app for iOS and Android lets reps view dashboards and reports, add registrations and follow contests on the road. With home screen widgets, a rep can check their numbers without even opening the app, and iPhone users can see them on an Apple Watch too. Read more about mobile dashboards.
Artificial intelligence and natural language querying
Building dashboards used to require a deep understanding of database structures. Now AI features let you build reports through plain conversation. Salesforce offers Tableau Agent, and Databox offers AI Analyst and Genie. Plecto includes an AI Formula Assistant and lets you build dashboards in a conversation through Plecto's MCP integration, which works with Claude and ChatGPT. A sales manager can type a simple request and get a formatted dashboard back.
Reporting layers versus data modeling engines
Buyers often confuse reporting layers with data modeling engines. Understand the difference before you choose a platform.
A reporting layer reads the data as it exists in your CRM and displays it visually. It does not change the underlying numbers. If your CRM says you closed 10 deals, the reporting layer shows a bar chart with 10 deals. This approach works well for live motivation and daily tracking.
A data modeling engine computes forecasts and restructures the data. Tools like Power BI or Salesforce CRM Analytics take historical data, apply statistical models and predict future outcomes. These engines need clean historical data to work. If your team struggles with basic CRM adoption, a modeling engine will only produce confident predictions from flawed data. Fix the data entry habit first, then forecast.
Gamification and coaching: beyond basic CRM data visualization
Displaying numbers on a screen is only the first step. To fix CRM adoption for good, tie those numbers to motivation. Plecto goes beyond data visualization by building gamification into the dashboard.
When a rep logs a sale in the CRM, Plecto can trigger a notification on the office TV. The platform includes live contests, achievement badges and Coins that employees spend in the Reward Store. This immediate feedback loop encourages reps to log their activities the moment they happen, because the update is what earns the recognition.
Plecto also includes structured coaching tools. Managers can use Performance Agreements, One-on-Ones and Quizzes to help their teams improve. Combine live data with active coaching and the dashboard turns from a passive display into an active management tool.
Real estate case study: Home Østerbro
Home Østerbro is a Copenhagen franchise of Home, Denmark's best-known real estate agency. The Home network has 185 franchises, more than 900 employees and sells homes worth 40 billion DKK a year. Home Østerbro itself runs with 11 employees.
Before Plecto, the office tracked results on a physical whiteboard, and the online portal was too cumbersome to use daily. Partner Mads Frost explains why nobody checked the numbers:
“You had to go to a website and log in, and you have to click to get to another website, which shows you some KPIs… I don't think anyone did this on a daily basis because there were too many clicks.”
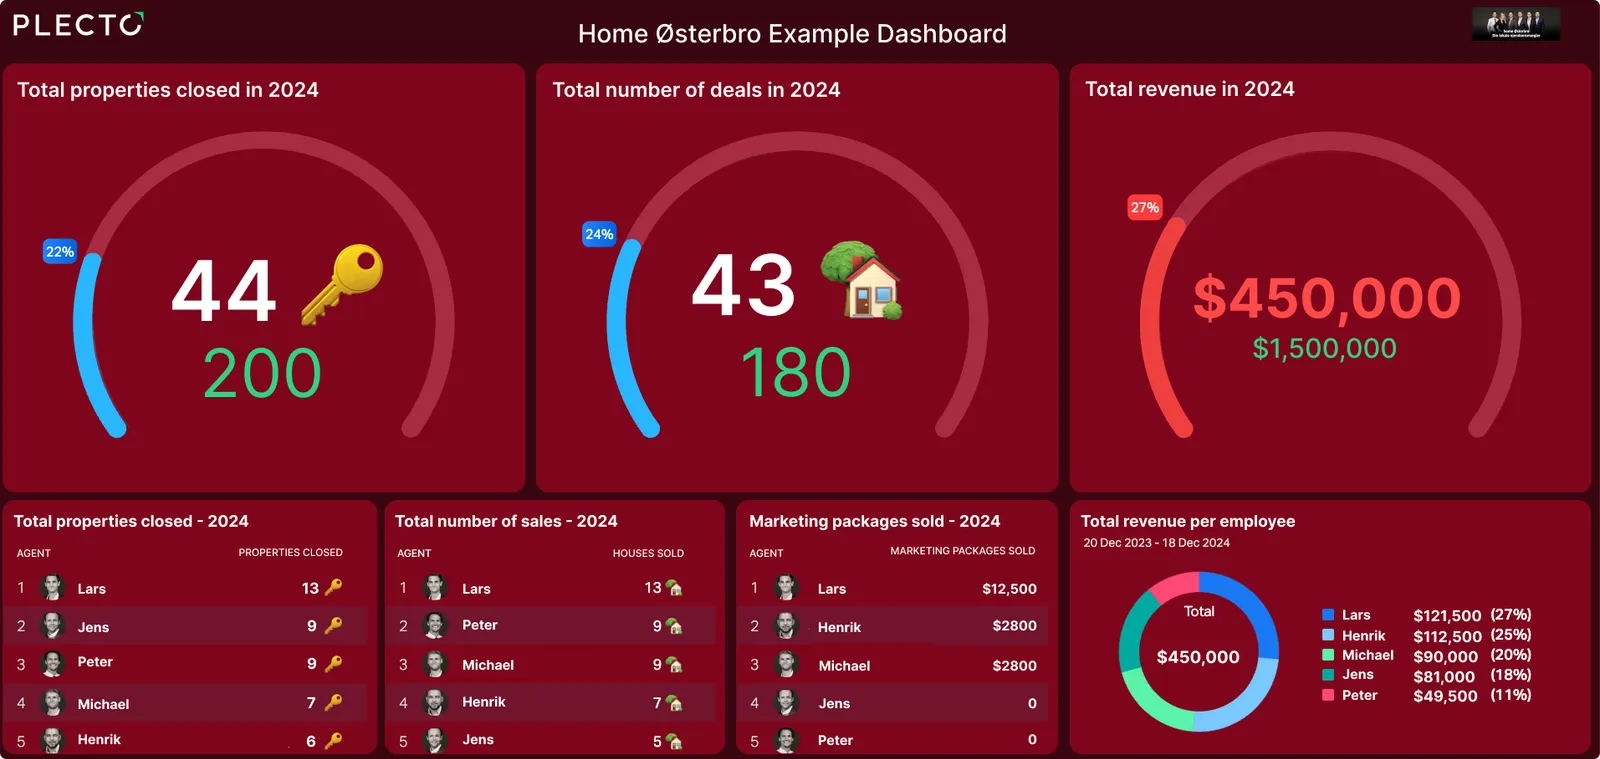
Today the dashboard runs on the office TV, and agents follow the same numbers in the Plecto mobile app. Owner Martin Berg calls the live view "the most important thing Plecto could give us", because people can see what they and their colleagues are doing right now. Find similar setups in our real estate dashboard examples.
Put your CRM data visualization on office screens
A dashboard hidden in a browser tab does not change behavior. To get the most out of it, put the data where everyone can see it. Plecto runs slideshows through native TV apps for LG, Samsung and Android TV, and on Google Chromecast. You can rotate through dashboards automatically, showing sales metrics for one minute and customer support response times the next. Our TV dashboard guide covers the setup.
For board meetings or executive reviews, you do not need to screenshot the TV. Plecto reports export to PowerPoint and Excel, and you can schedule exports that arrive in your inbox every hour, day, week or month. Your executive team sees the same numbers your sales team sees on the floor.
Take the next step with CRM data visualization tools
Your CRM holds the key to predictable revenue, but only if your team uses it. The right CRM data visualization tools turn tedious data entry into a public, rewarding activity and close the gap between the reps doing the work and the managers planning the strategy. If you are ready to stop chasing your team for deal updates and start driving performance, start a 14-day free trial and build your first live dashboard today.
Questions
Frequently asked questions about CRM data visualization tools
Business intelligence (BI) tools process large datasets from many sources to run historical analyses and predictive models, usually on a refresh schedule. CRM data visualization tools focus on live operational metrics, giving teams immediate visibility into daily performance so they act on it and keep the CRM up to date.
Remove the friction of finding the data. Do not make reps log in to a separate system. Show the dashboards on office TVs with a smart TV app or Chromecast, and give field reps mobile access so they can check their numbers on the road. Then tie the metrics to contests and achievements, so the team has a personal stake in the numbers.
Start your 14-day free Plecto trial today.
Enjoyed the article? Share it:


