 Sign in

Stripe dashboard examples: live billing KPIs next to your CRM
Turn Stripe payments, invoices, refunds and disputes into a live dashboard your team can see on a TV, with targets and notifications.
What is a Stripe dashboard?
A Stripe dashboard is a visual summary of your Stripe data, such as payments, invoices, refunds, disputes and customers. Stripe has its own Dashboard for managing your account. A live Stripe dashboard in Plecto puts the same billing activity on a TV, next to CRM and support data, with targets and notifications.
Most people searching for a Stripe dashboard want dashboard.stripe.com, and it is the right place to manage payments. This page covers both: what Stripe's own Dashboard gives you, and how teams build a Stripe KPI dashboard that the whole company can see. Plecto connects through a Stripe integration that is currently in BETA, which means it is subject to change based on testing and your feedback.
What Stripe's own Dashboard and reporting give you
According to Stripe's documentation, the Dashboard is where you manage and configure your account. Its main reporting features are:
- Home. Analytics and charts about business performance, plus notifications such as unresolved disputes. You can add or remove widgets under "Your overview".
- Reporting. Export historical transactions, payments and payouts, filter reports and add custom columns, and open financial reports for an accounting-grade view.
- Billing. Manage invoices and subscriptions, and generate revenue reports. Billing, Tax and Radar also offer product-specific analytics.
- Sigma. An interactive SQL environment for custom reports, with scheduled exports in CSV or JSON, covered in Stripe's data documentation.
- Mobile app. Monitor business metrics and get push notifications on iOS and Android.
For payment operations and finance reporting, that is a strong toolkit. What it does not do is put your billing numbers on a wall screen beside sales pipeline and support tickets, or compare them with targets your whole team sees. That is the gap a live Stripe dashboard fills. Stripe's plans and add-ons vary, so check Stripe's site for what your account includes.
Stripe dashboard examples: payments and invoices
Payments and invoices overview
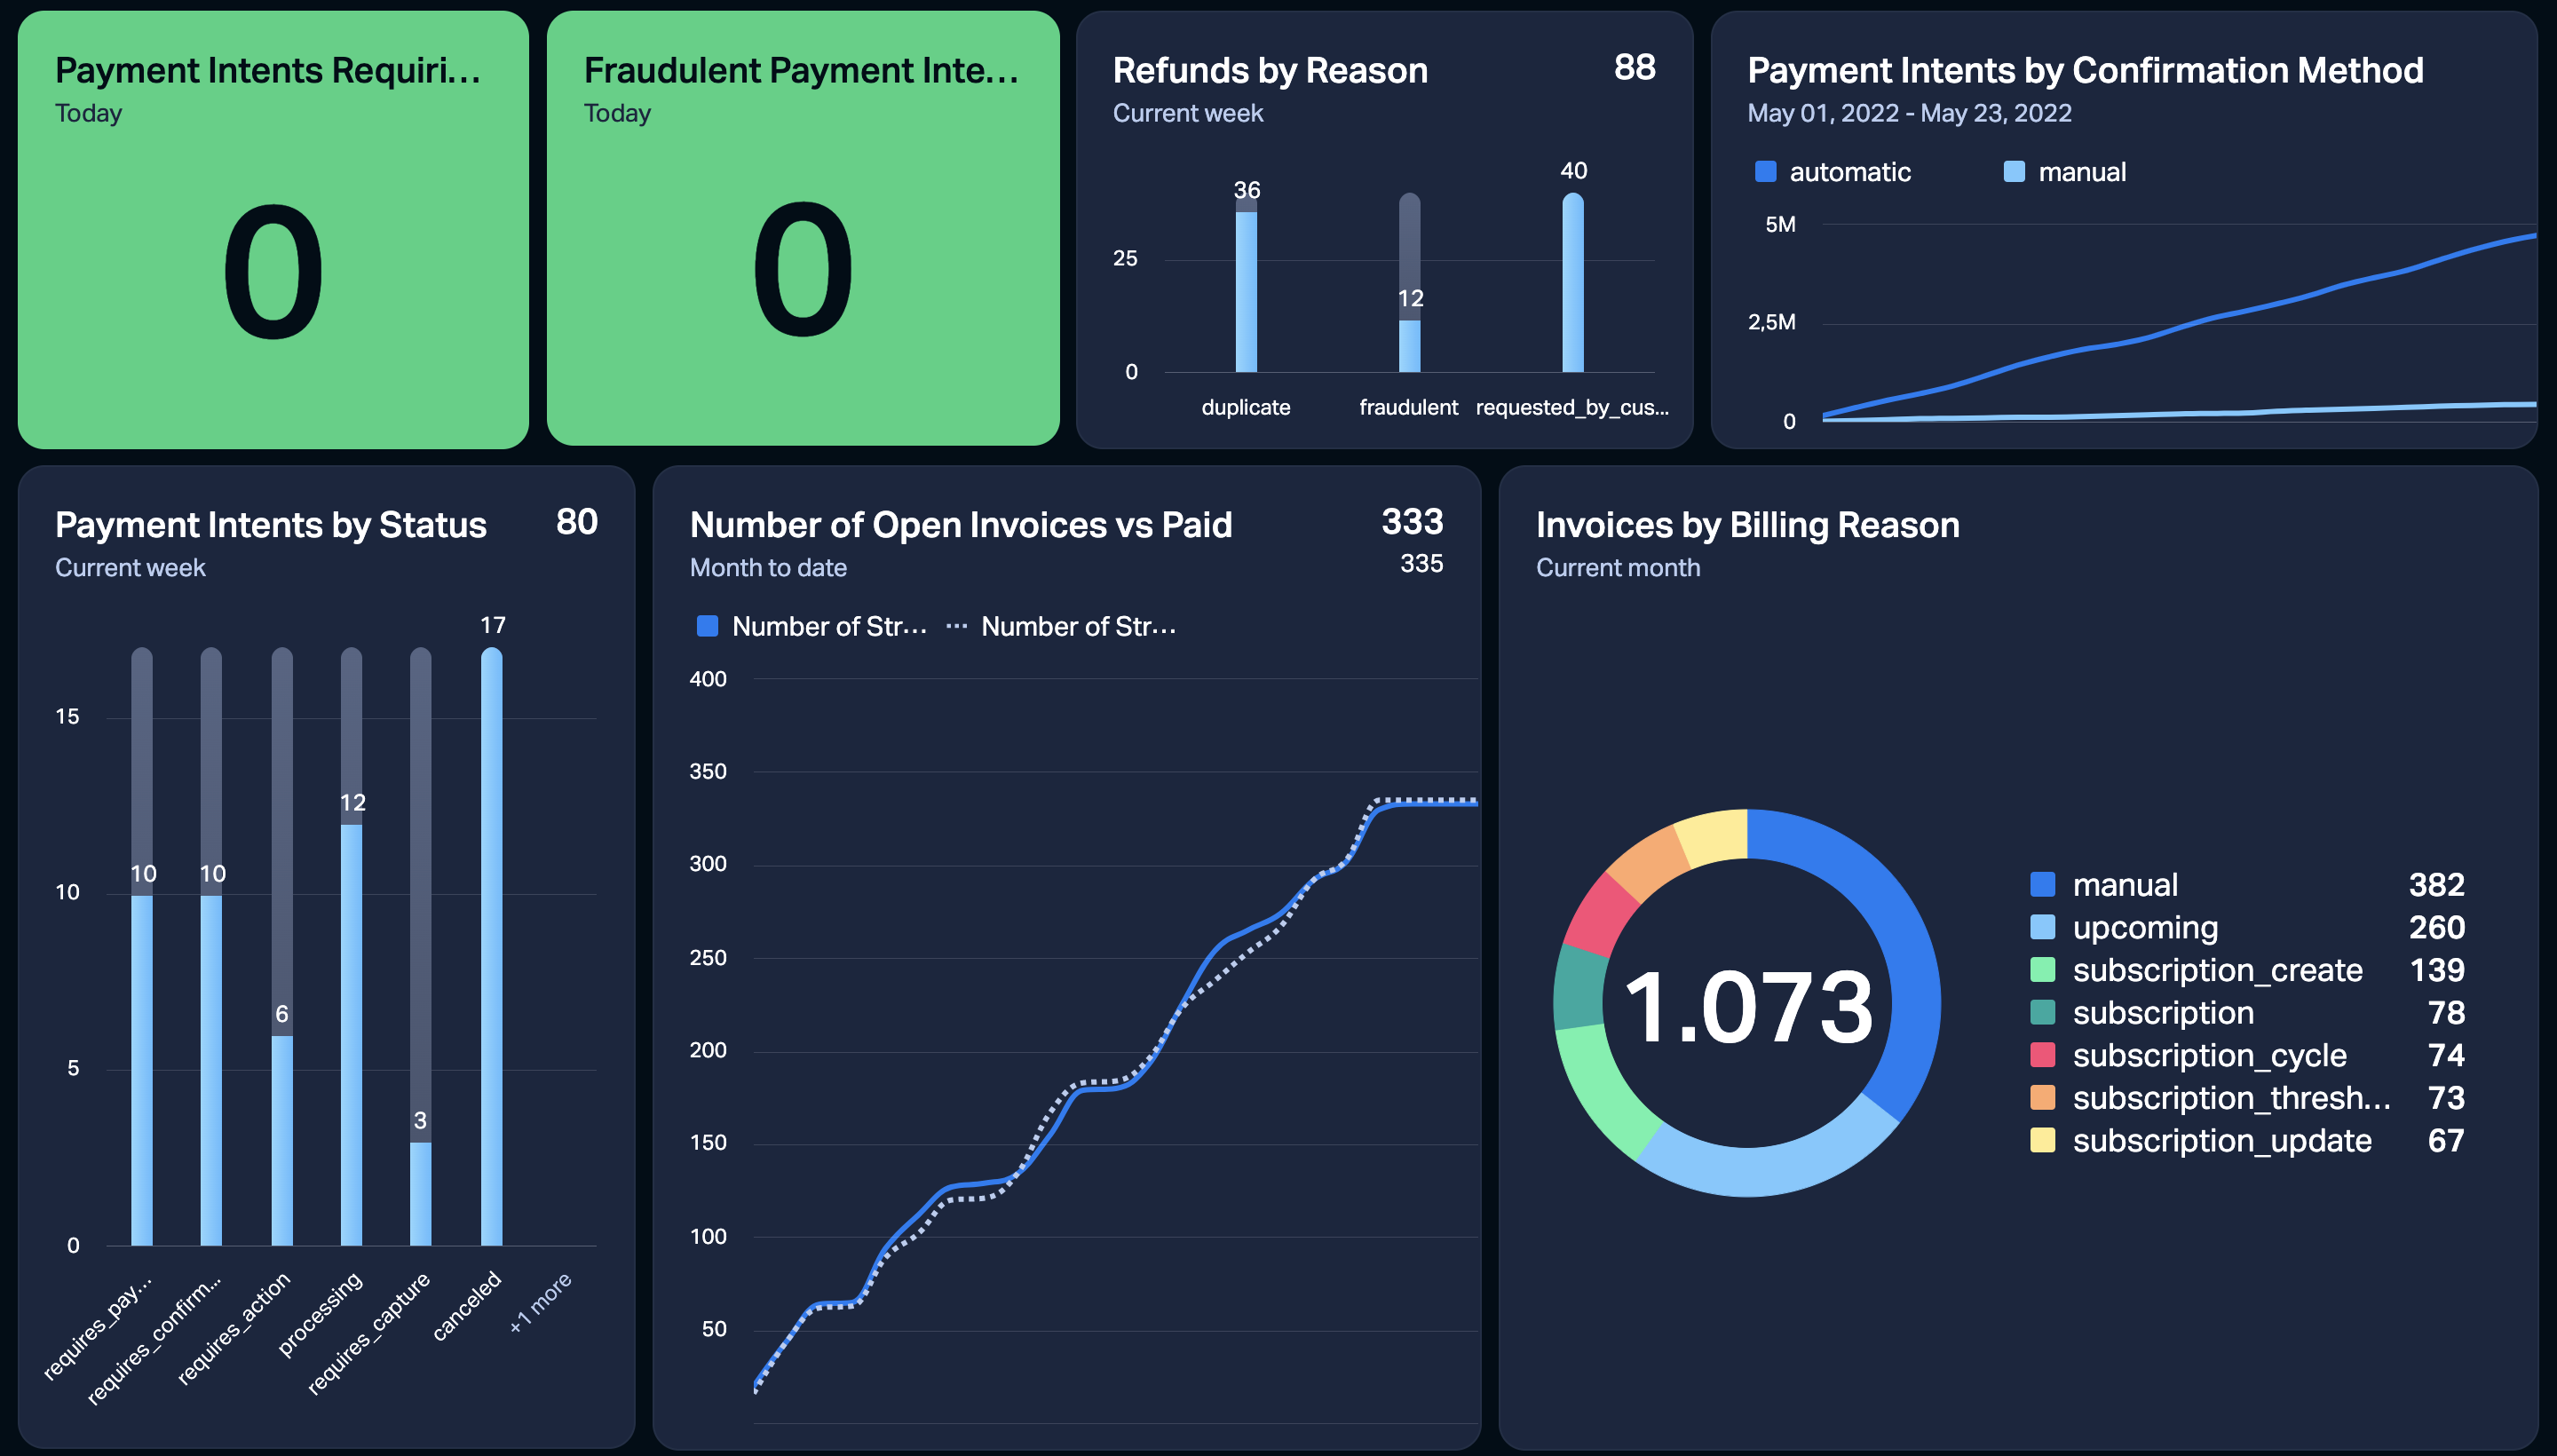
This Plecto dashboard is built on Stripe data. Two green tiles show payment intents that require action and fraudulent payment intents today, both at zero. Below them are refunds by reason this week (duplicate, fraudulent, requested by customer), payment intents by confirmation method, payment intents by status, the number of open and paid invoices month to date, and a donut of invoices by billing reason with 1,073 in total.
Billing reason is the useful split. Invoices marked subscription_create are new subscriptions, subscription_cycle are renewals and subscription_update are plan changes, so finance can see new business and renewals apart without opening a report.
A SaaS overview: billing KPIs above CRM data
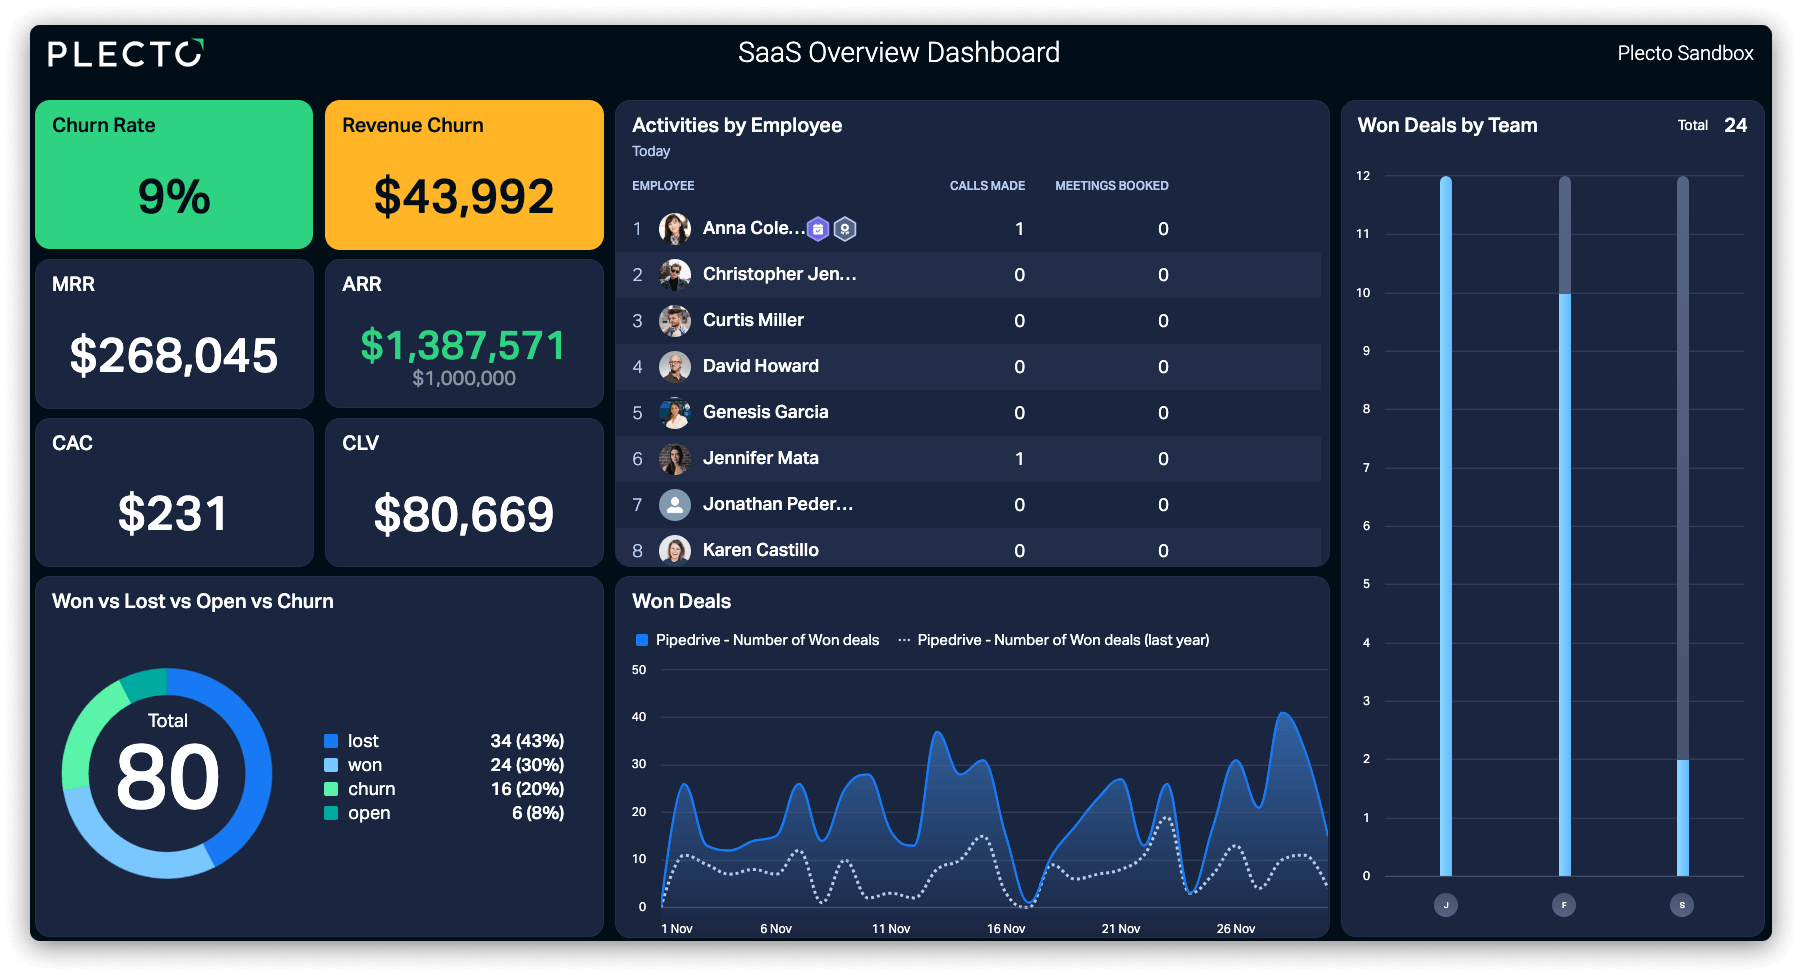
Billing numbers mean more next to the pipeline that produced them. This SaaS overview example is a Plecto dashboard that shows churn rate at 9%, revenue churn, MRR, ARR against a $1,000,000 target, CAC and customer lifetime value. Below sit activities by employee, won deals by team, a won, lost, open and churn donut, and a won deals line from Pipedrive compared with last year.
The point is the layout: billing KPIs on the top row, sales activity underneath. You can build the same layout with Stripe invoice KPIs on top and CRM data below. See more in our SaaS dashboard examples.
A subscription overview for a Stripe KPI dashboard
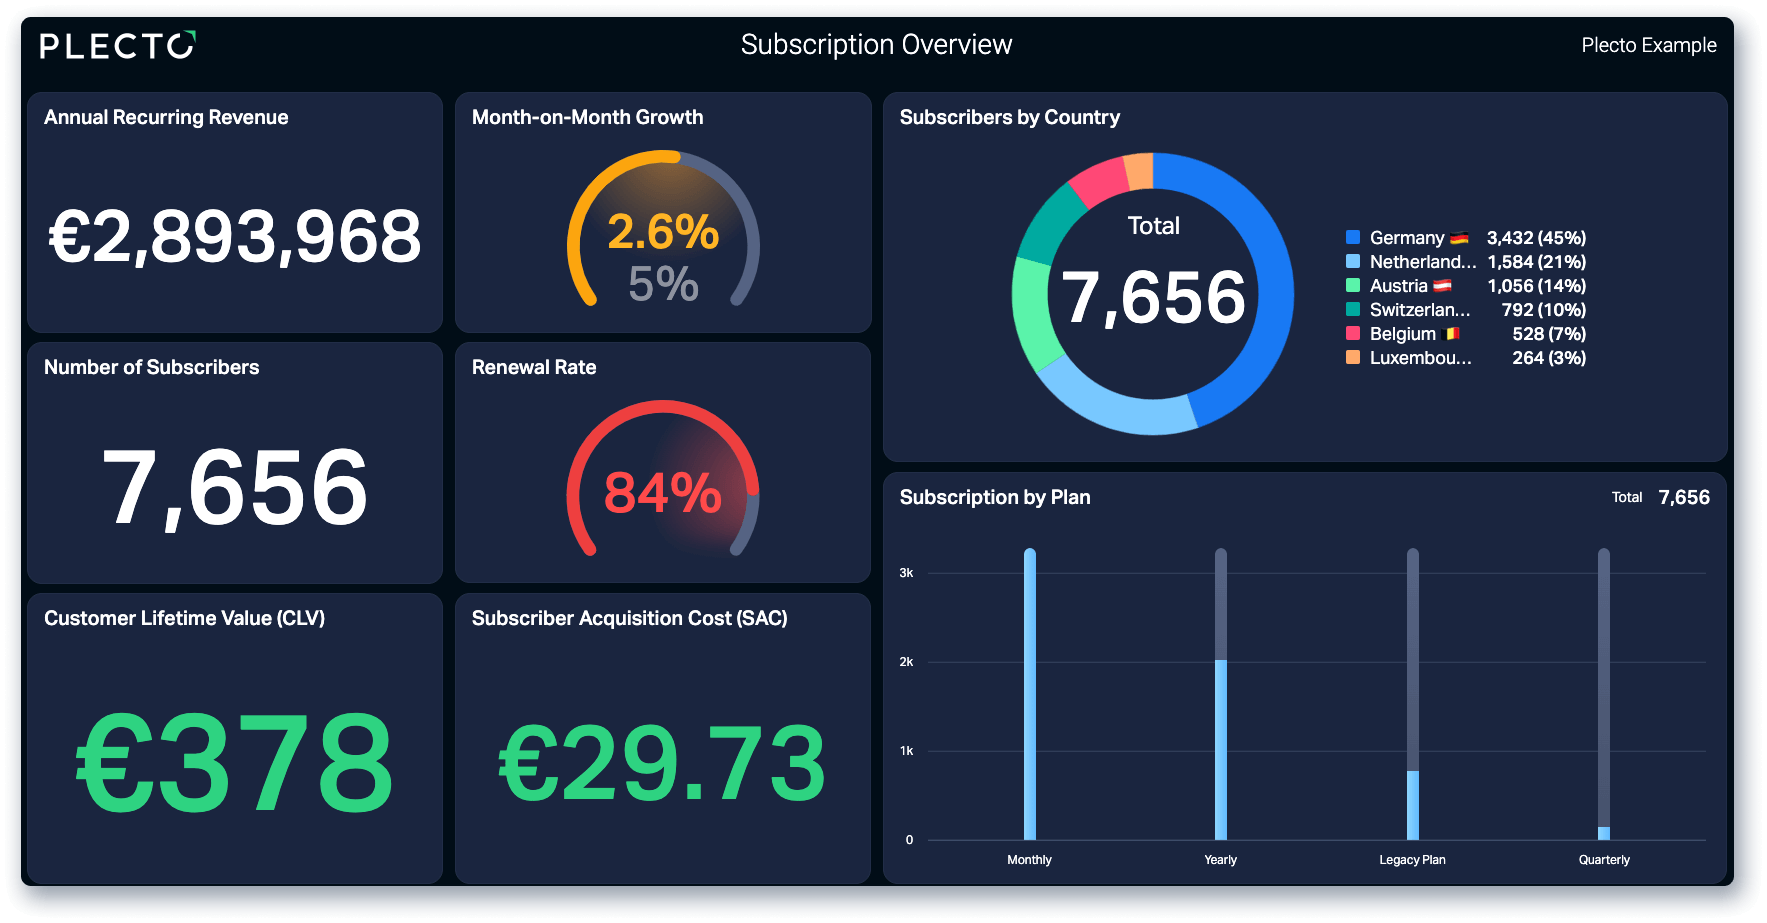
Subscription businesses want a calmer, longer-term view. This Plecto example shows ARR, a month-on-month growth gauge at 2.6% against a 5% target, number of subscribers, renewal rate at 84%, customer lifetime value, subscriber acquisition cost, subscribers by country and subscriptions by plan.
Treat it as a target for what your Stripe dashboard can grow into. Some of these numbers, such as renewal rate or lifetime value, need formulas on top of invoice data, and the next sections are honest about where Stripe data stops. More examples are on our page for dashboards for subscription businesses.
Which Stripe revenue dashboard KPIs should you track?
Start with billing activity you can import today, then add subscription KPIs.
Value of new charges
Money charged in the period. A simple daily revenue pulse for the whole team.
Number of new charges
How many payments came in. Compare it with value to spot a shift in order size.
Value of new refunds
Refunds issued, which you can split by reason to see why customers ask for money back.
Number of new disputes
Chargebacks opened. Put it in red so someone responds before a deadline passes.
Monthly recurring revenue (MRR)
The core SaaS number. See the note below on how it relates to Stripe data.
Plecto also has KPI pages for the value of new payment intents and the value of new balance transactions. For formulas and definitions of the full SaaS set, read the 10 SaaS KPIs worth tracking.
A note on MRR. The Stripe integration in Plecto has no Subscriptions data type. You can track billing activity live and split invoices by billing reason, and you can build revenue KPIs as formulas on invoice fields. For full subscription maths such as MRR movements and cohorts, a subscription-analytics tool goes deeper, or you can use Plecto's Chargebee integration, which imports Subscriptions.
What you can import from Stripe into Plecto
Plecto imports nine data types from Stripe. Seven of them update instantly with webhooks and every 15 minutes, and two update every 15 minutes. The default date field is created for all of them, and none support custom fields or relations.
| Data type | Update frequency |
|---|---|
| Charges | Instant with webhooks and every 15 minutes |
| Customers | Instant with webhooks and every 15 minutes |
| Disputes | Instant with webhooks and every 15 minutes |
| Invoice Lines | Instant with webhooks and every 15 minutes |
| Invoices | Instant with webhooks and every 15 minutes |
| Payment Intents | Instant with webhooks and every 15 minutes |
| Refunds | Instant with webhooks and every 15 minutes |
| Balance Transactions | Every 15 minutes |
| Fee Details | Every 15 minutes |
Stripe can include sample data. The Livemode field is True for real data and False for sample registrations, so filter on Livemode = True in the data source and in your formulas. The Stripe integration guide has the details.
Combine your Stripe dashboard with CRM and support data
Stripe knows what customers paid, but a Stripe dashboard on its own is blind to the rest. It does not know which rep closed the deal or whether the customer has an open support ticket. Plecto has 150+ integrations, so you can put them on one screen.
- CRM. Show new subscription invoices beside won deals from HubSpot, Salesforce or Pipedrive.
- Support. Add tickets and satisfaction from Zendesk, so a spike in refunds or disputes appears next to the ticket backlog.
- Targets and notifications. Set a target per KPI, use conditional colors, and add a notification for events such as a new dispute.
Plecto is not a replacement for Stripe's Dashboard or for accounting-grade reporting. Keep Stripe as the system of record and use Plecto as the live layer your team actually looks at. To weigh other options, compare SaaS KPI dashboard software.
Show your Stripe dashboard on a TV
A live number only helps if someone sees it, so put your Stripe dashboard where the team already looks. Add the dashboard to a Plecto slideshow and play it on an office TV through the Plecto TV app or the TV's browser. The TV dashboards guide walks through the setup.

For leadership, Plecto reports can be exported to Excel or PowerPoint, or scheduled by email every hour, day, week or month.
How to set up a Stripe dashboard in Plecto
- Connect Stripe. Go to Data sources > New data source > Stripe, click Next and log in to your Stripe account.
- Approve access. Click Approve to give Plecto access to your Stripe data.
- Choose your data. Select the data types to import, such as Invoices, Charges and Refunds.
- Configure the data source. Set the title, default date and fields, then choose how much history to import and how long to keep it.
- Filter sample data. If a Livemode field appears, filter on Livemode = True in the data source and in formulas.
- Build KPIs and a dashboard. Create formulas, add widgets and put the dashboard on a TV.
The full steps are in the Stripe integration guide. Plecto has a 14-day free trial with no credit card required.
Stripe dashboard FAQ
It is a visual summary of your Stripe data, such as payments, invoices, refunds and disputes. Stripe has its own Dashboard for managing your account, with Home analytics, reports, Billing and Sigma. Tools like Plecto show Stripe data live on TVs with targets.
Stripe's Dashboard has a Home page with charts and notifications, a Reporting section for exports and financial reports, Billing analytics, and Sigma for custom SQL reports. Which features you can use depends on your account, so check Stripe's documentation.
It depends on the job. Subscription-analytics tools go deeper on MRR movements and cohorts. Plecto fits when you want Stripe billing activity next to CRM data on one live screen, with targets and TVs. Our roundup covers the options in SaaS KPI dashboard software.
Once connected, Plecto imports Stripe data every 15 minutes, and instantly for most data types through webhooks, so dashboards update without manual work. Revenue KPIs are formulas on invoice fields. For full subscription metrics, a dedicated analytics tool or the Chargebee integration, which imports Subscriptions, may fit better.
Not directly from subscriptions, because the Stripe integration has no Subscriptions data type. You can track invoices by billing reason, charges, refunds and disputes, and build revenue formulas on invoice data. For MRR movements and cohorts, consider a subscription-analytics tool or Plecto's Chargebee integration.
Charges, Customers, Disputes, Invoice Lines, Invoices, Payment Intents and Refunds update instantly with webhooks and every 15 minutes. Balance Transactions and Fee Details update every 15 minutes. The integration is in BETA and may change.
Yes. Plecto has 150+ integrations, so you can show Stripe billing KPIs next to deals from HubSpot or Salesforce and tickets from Zendesk on the same dashboard.
Depending on your Stripe setup, Plecto may import sample registrations. The Livemode field is True for real data and False for sample data. Filter on Livemode = True in the data source and in your formulas to see only actual data.
Yes. Add the dashboard to a Plecto slideshow and play it on office TVs through the Plecto TV app or the TV's browser. See the TV dashboards guide for the steps.