 Sign in

Zendesk dashboard examples: real-time KPIs for your support team
Turn Zendesk tickets, satisfaction ratings and calls into a live dashboard your agents can see on a TV, with targets, leaderboards and contests.
What is a Zendesk dashboard?
A Zendesk dashboard is a visual summary of your Zendesk Support data, such as ticket volume, response times, agent activity and customer satisfaction, shown as KPIs, charts and tables. Zendesk's own Explore tool covers analysis. A real-time version in Plecto puts the same numbers on a TV with targets and leaderboards.
Below are Zendesk dashboard examples built in Plecto, the KPIs worth putting on one, how to create a dashboard inside Zendesk, and how it compares with a live one. Plecto connects through a native Zendesk Support integration and imports tickets, satisfaction ratings, events and calls every 2 minutes.
Zendesk dashboard examples for support teams
Support team overview
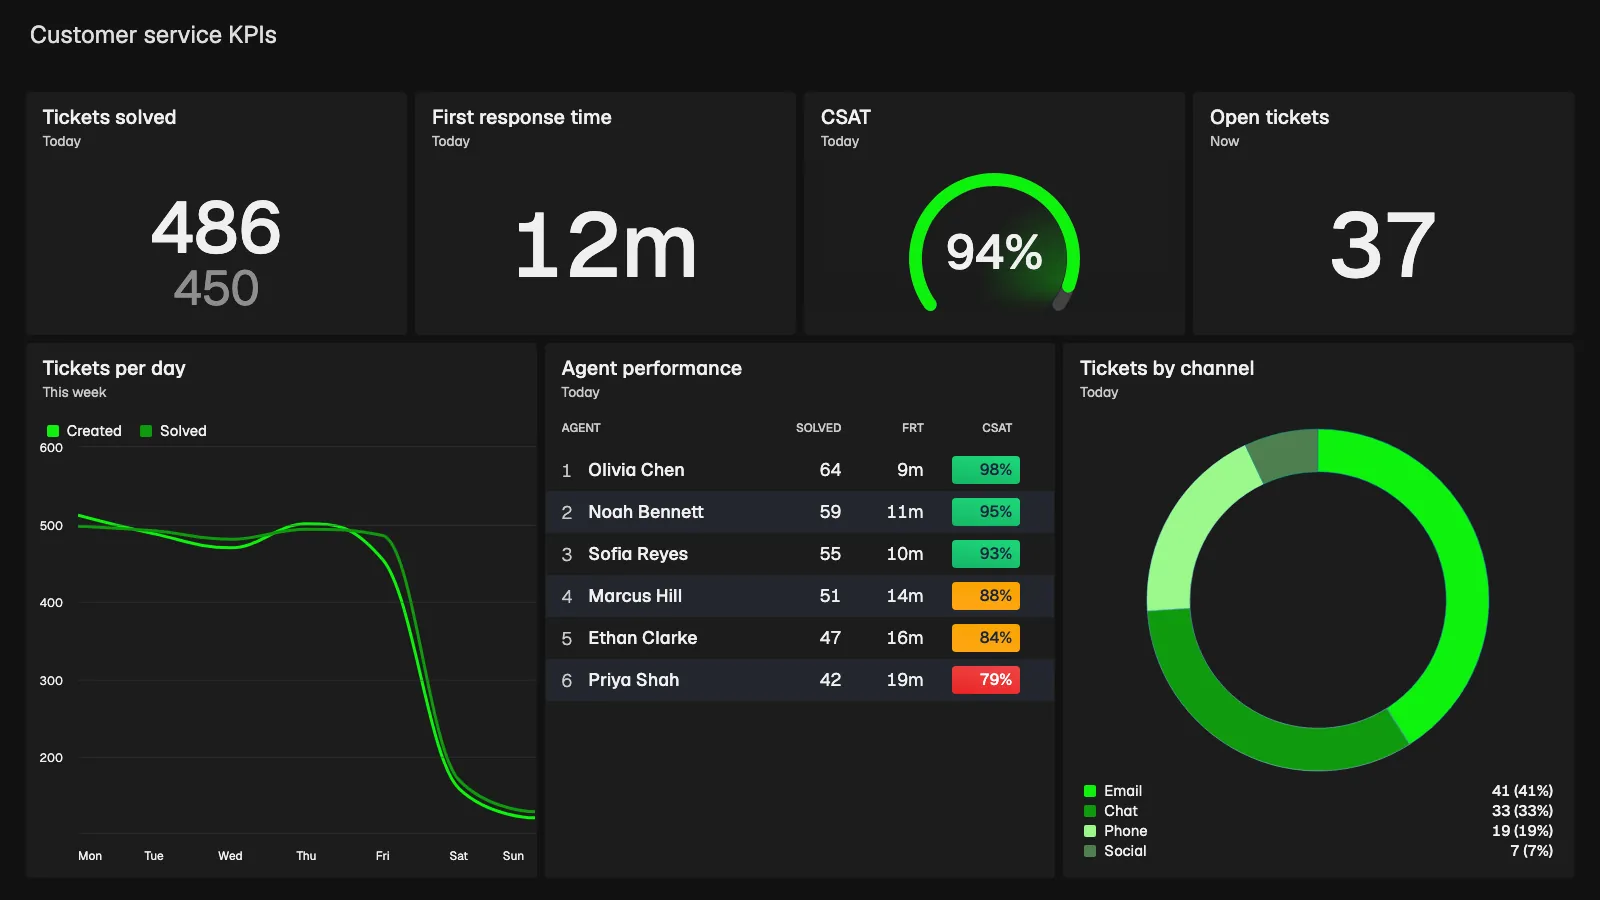
The dashboard in the hero is a customer service KPI view of the kind you build on Zendesk ticket data. Four tiles sit across the top: tickets solved against a target (486 against 450), first response time, a CSAT gauge at 94% and open tickets right now (37). Below them are a line chart of tickets created and solved per day, an agent table with solved tickets, first response time and CSAT per agent, and a donut chart of tickets by channel.
This Zendesk dashboard works because the team sees the backlog and the response time in one glance. A lead can spot a slow day before the queue gets out of hand, without opening a report.
Agent performance
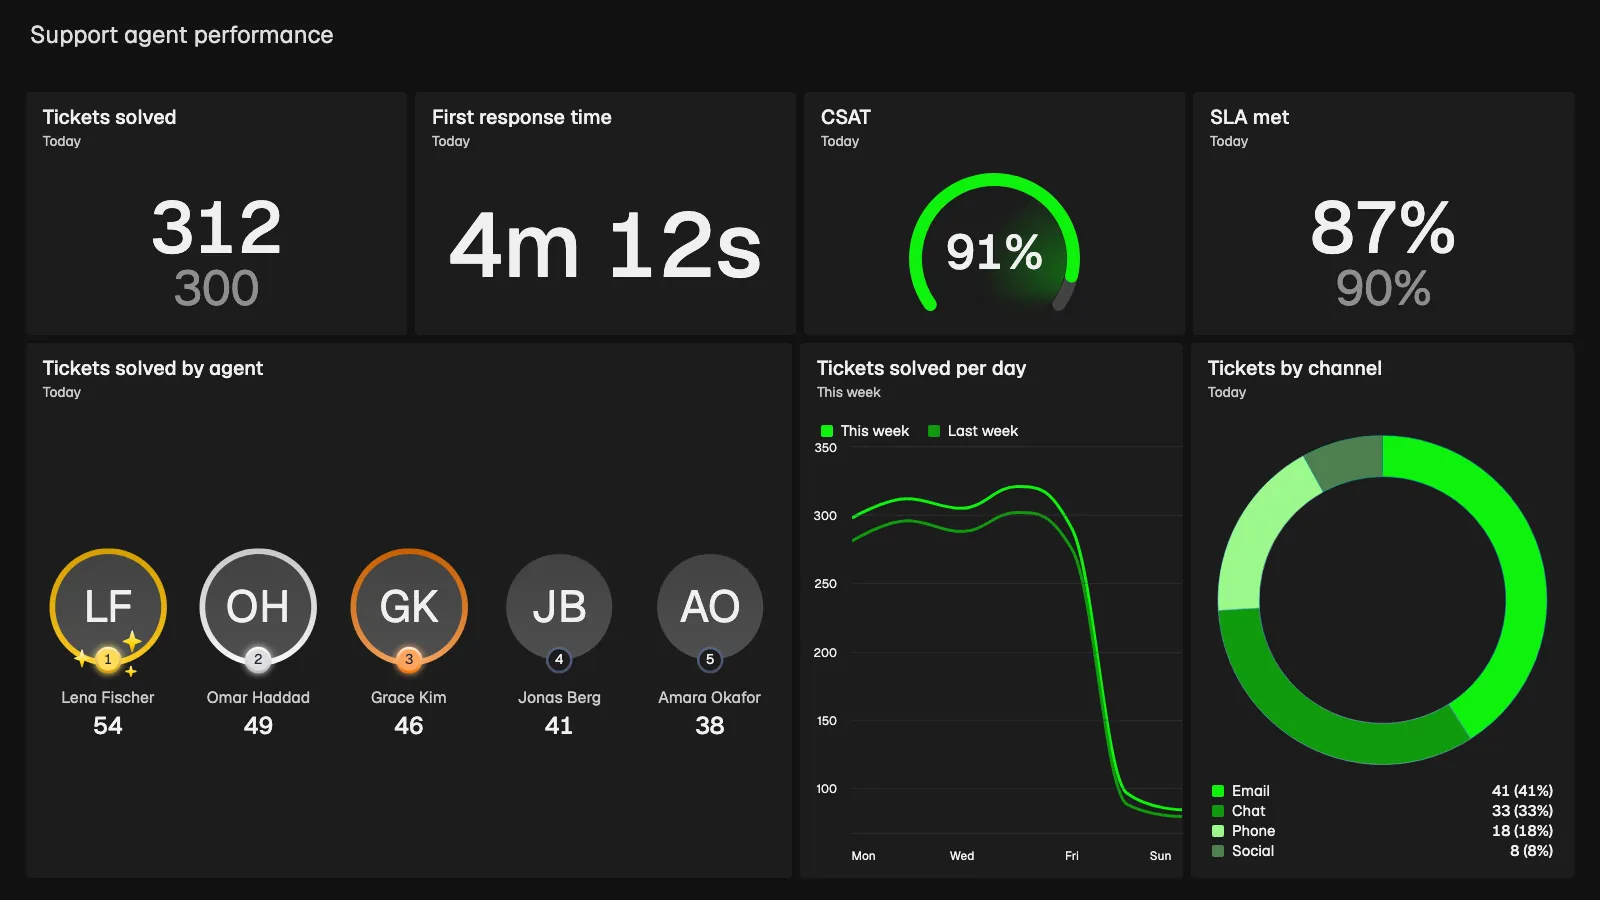
This agent performance view is built for team leads and the floor. It shows tickets solved today against a target (312 against 300), first response time, a CSAT gauge, SLA met (87% against a 90% target), a podium of the top five agents by tickets solved, a week-on-week line chart and tickets by channel.
Agents see where they rank, and a manager sees which channel is driving volume. Zendesk tickets carry an assignee, so each number can be split per agent.
A Zendesk calls dashboard for phone support
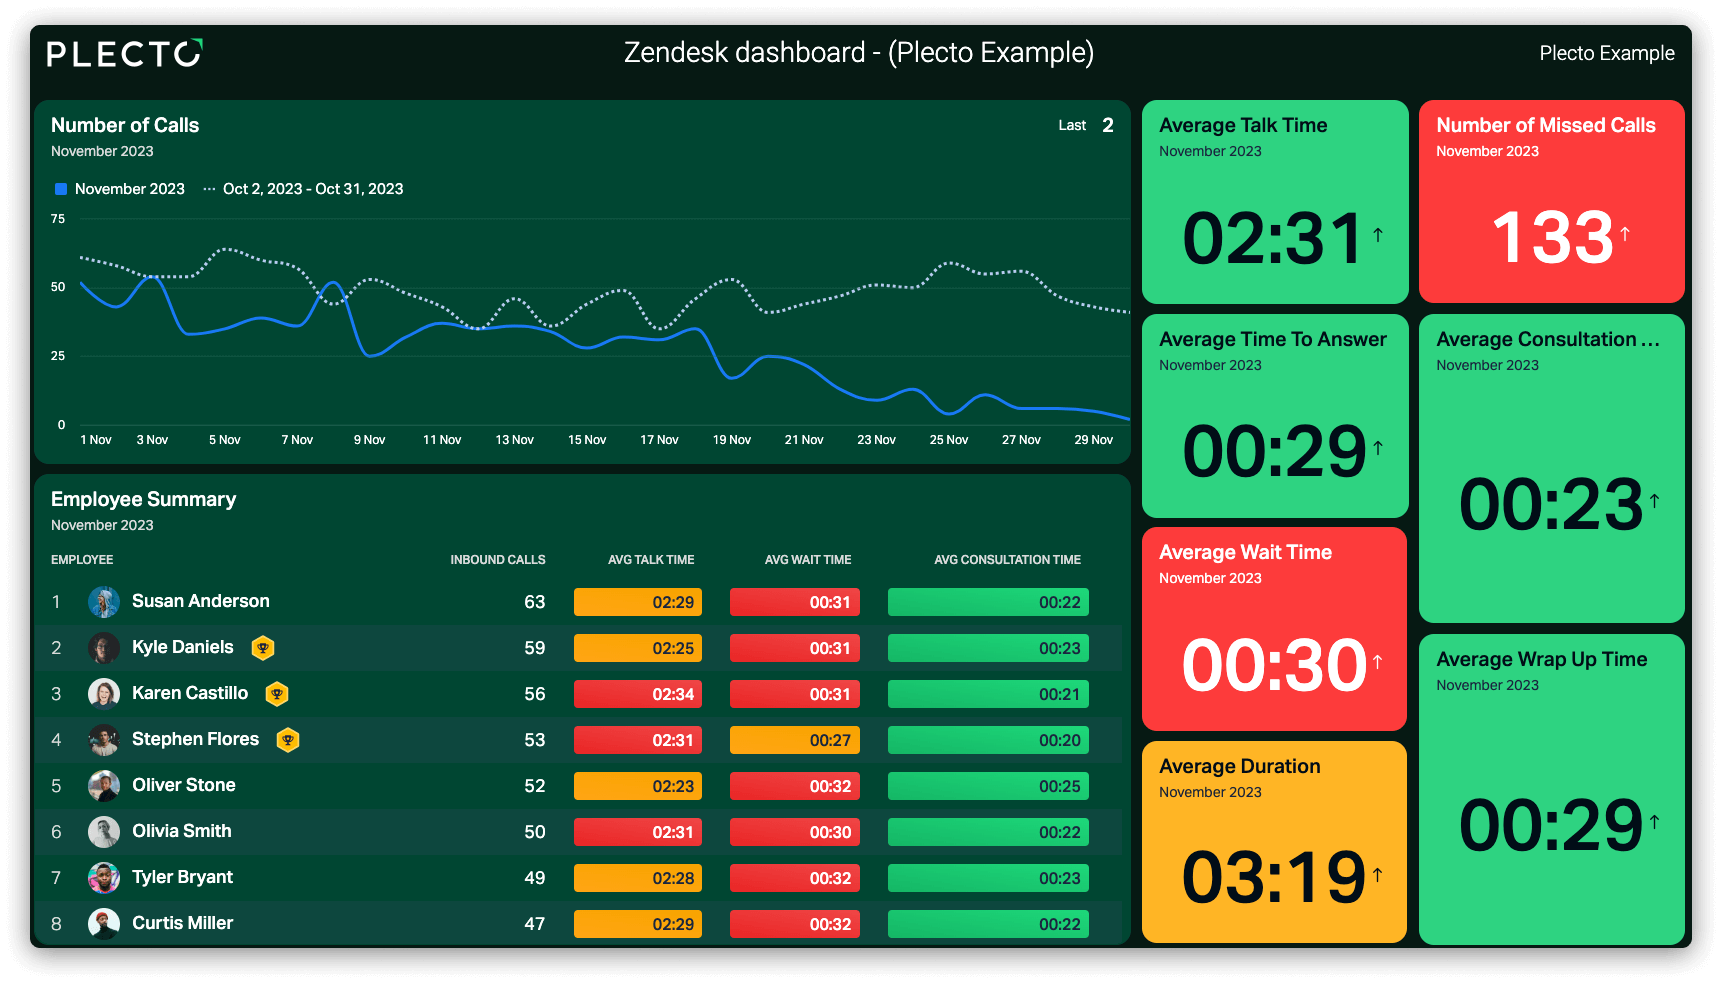
If your agents take calls through Zendesk, the Calls data type gives you a separate view. This example shows the number of calls over the month against the previous period, tiles for average talk time, time to answer, wait time and wrap-up time, a red tile for missed calls, and an employee summary with inbound calls and average talk, wait and consultation time per agent.
Conditional colors do the work. A wait time in red tells an agent and a manager where to look before anyone reads the number. If calls run through a separate phone system, see contact center dashboards.
A CSAT view for your Zendesk KPI dashboard
Customer satisfaction deserves its own screen. This customer satisfaction dashboard shows CSAT for all teams and per country against an 85% target, CSAT per agent with conditional colors, and a feed of the latest customer feedback with the agent's name and the customer's comment.
Plecto imports Zendesk satisfaction ratings and matches each one to the assigned agent, so CSAT is a per-agent number and the comments are visible to the person who earned them. Read more in our customer satisfaction dashboard examples.

Which Zendesk KPIs should you track?
Keep the main screen to a handful of numbers agents can act on today.
First response time
How fast a customer gets a first reply. It is the number customers feel first, so show it by agent and by channel.
Average resolution time
How long tickets take from creation to solved. A rising line usually points to a backlog or a hard category of tickets.
Customer satisfaction (CSAT)
The share of satisfied ratings. In Plecto it comes from Zendesk Satisfaction Ratings, matched to the assigned agent.
Ticket backlog
How many tickets are still unresolved. Watch the trend, not just today's count.
Oldest unanswered ticket
The ticket that has waited longest without a reply. Put it in red and it rarely stays there long.
Net Promoter Score
Loyalty over the longer term. It complements CSAT, which measures a single interaction.
Customer effort is another good one: see Customer Effort Score. For ready-made formulas, including first response time and handle time, use the guide to 10 KPIs for customer service. The full customer service dashboard page shows how these fit together.
How to create a Zendesk dashboard inside Zendesk
Zendesk's analytics tool is called Explore, and it is the quickest way to build reports and dashboards if the people who need the numbers already work in Zendesk. In outline:
- Open Explore. Click the Dashboard icon in the left sidebar of Explore and choose the Zendesk Support dashboard from the list.
- Start from the prebuilt view. The Support dashboard has tabs such as Tickets, Efficiency, Assignee activity, Unsolved tickets, Backlog, Satisfaction and SLAs, covering ticket volume, reply and resolution times, backlog and CSAT.
- Clone it or build your own. Zendesk's help center says you can customize the Support dashboard by cloning it, or write your own reports for more complex needs.
- Add reports and arrange them. A custom dashboard is made of reports. Add the ones you need, arrange them and add filters if viewers want to slice the data.
- Share it. Share the finished dashboard with the groups that need it.
What you can do depends on your Zendesk plan and Explore plan, so check Zendesk's help center. Start with Zendesk's guide to analyzing your Support ticket activity and agent performance and its reporting and analytics resources. When the dashboard has to run on a TV for the support floor, show targets and leaderboards, or combine Zendesk with other systems, the next section explains what changes.
Zendesk Explore vs a real-time Zendesk dashboard
Explore is the right place for analysis. It works on your Zendesk data, needs no extra tool, and the prebuilt Support dashboard covers most standard ticket reporting. If your questions are mostly "what happened last quarter", start there.
A real-time Zendesk dashboard solves a different problem: getting numbers in front of people who are not looking at a report.
- Refresh. Zendesk says Explore dashboards are updated on a schedule that depends on your Explore plan, and it is removing live reporting from Explore on January 25, 2027, in favor of real-time monitoring on Professional and Enterprise plans. In Plecto, Zendesk tickets, satisfaction ratings, events and calls are imported every 2 minutes, and streaming metrics such as live agent status refresh every 10 seconds.
- A screen for the floor. Plecto dashboards run on any office TV through a slideshow, at no extra cost per TV.
- Targets and motivation. Gauges against a target, conditional colors, leaderboards and contests are built for agents. See customer service gamification for how teams use them.
- More than Zendesk. Show calls from a separate phone system or pipeline from a CRM next to tickets, using any of our 150+ integrations.
Plecto is not a replacement for Explore or for deep analysis. Many teams keep Zendesk as the system of record and add Plecto as the live layer on top. For a side-by-side view, download the Plecto vs Zendesk analytics one-pager.
Dashboard tools that integrate with Zendesk
Several dashboard tools connect to Zendesk, and they do different jobs. Here is what each vendor says about how it works.
| Tool | Fits when | Keep in mind |
|---|---|---|
| Plecto | You want a live support view on TVs with targets, leaderboards and contests, plus other systems next to Zendesk | Not a BI warehouse; Zendesk data imports every 2 minutes; contests are on Large and Enterprise |
| Zendesk Explore | You want analysis and prebuilt reports inside Zendesk | Dashboards update on a schedule that depends on your Explore plan |
| Geckoboard | You want a simple support wallboard; its Zendesk page describes TV display and metrics that update automatically | With omnichannel routing, agent availability comes from a separate Zendesk Agent Status integration that updates every 30 seconds |
| Klipfolio | You want to build custom Zendesk metrics; it offers TV mode, public links and scheduled email | You set the refresh schedule yourself, as short as one minute |
| Power BI | You want to model Zendesk with other company data in one governed model | Microsoft's Zendesk template app refreshes once a day and needs a Zendesk admin account |
Check each vendor's pricing page for current plans. For a wider look at the market, see our customer service dashboard software comparison.
Show your Zendesk KPIs on a TV
A support team acts on what it sees, so put the Zendesk dashboard where everyone can see it. Plecto dashboards run on an unlimited number of TVs, through slideshows, the Plecto TV app or the browser on any TV. They also work on mobile.
Add the dashboard, a leaderboard or a contest to a slideshow, open tv.plecto.com on the TV to get a four-digit code, and enter it under Slideshows > Actions > Activate. Read the TV dashboards guide for the full walkthrough.
How to set up Zendesk KPI dashboards in Plecto
- Connect Zendesk Support. Go to Data sources > New data source > Zendesk Support and enter your Zendesk subdomain, for example mycompany.zendesk.com.
- Choose your data. Pick from Tickets, Satisfaction Ratings, Events and Calls. Tickets and Events support custom fields, so your own ticket fields can become KPIs.
- Create your KPIs. Go to Formulas > New formula. Start from the 10 KPIs for customer service guide.
- Build the dashboard. Add widgets under Dashboards: number tiles, a CSAT gauge, a table per agent and a leaderboard.
- Add a contest or notification. Start a support contest, or set a notification for tickets that wait too long.
- Put it on a TV. Add the dashboard to a slideshow and activate it on an office screen.
The Zendesk Support integration guide lists every step, and the Zendesk Support integration page covers the live wallboard setup. Plecto has a 14-day free trial with no credit card required.
Zendesk support dashboard FAQ
It is a visual summary of your Zendesk Support data, such as tickets, response times, agent activity and CSAT, shown as KPIs, charts and tables. Zendesk includes Explore for analysis, and tools like Plecto show the same data live on TVs with targets and leaderboards.
Open Explore, click the Dashboard icon and start from the Zendesk Support dashboard, then clone it or build your own from reports, add filters and share it. What you can edit depends on your plan. For a live dashboard on a TV with targets, connect Zendesk to Plecto instead.
It depends on the job. Zendesk Explore suits analysis inside Zendesk. Power BI suits modelling Zendesk with other company data. Plecto fits when you want real-time Zendesk support metrics on TVs, with targets, leaderboards and gamification, plus phone or CRM data on the same screen. See the full comparison.
Zendesk Tickets, Satisfaction Ratings, Events and Calls are imported every 2 minutes. Streaming metrics, such as live agent status, refresh every 10 seconds. If Zendesk rate limits the account, automatic imports pause until Zendesk allows more requests.
Yes. Plecto has 150+ integrations, so you can show Zendesk tickets next to calls from a phone system or deals from a CRM such as Salesforce or HubSpot on one dashboard. See all integrations.
You can import Tickets, Events, Satisfaction Ratings and Calls. Tickets and Events support custom fields. Events log each change to a ticket, such as a status change, a new comment or a changed custom field.
Yes. Add the dashboard to a Plecto slideshow and play it on office TVs through the Plecto TV app or the TV's browser. Plecto TVs are free on all plans. See the TV dashboards guide.
Zendesk is removing live reporting from Explore on January 25, 2027. Prebuilt live dashboards leave the Explore library and live components in custom dashboards stop showing data. Real-time monitoring on Professional and Enterprise plans replaces them. If your wallboard runs on an Explore live dashboard, plan the switch, or move the TV view to a tool such as Plecto.
No. Plecto does not replace deep analysis in Explore or a BI tool. Keep Explore for reporting and root-cause work, and use Plecto for the live Zendesk KPIs, targets and contests agents see every day.