 Sign in

Customer service dashboard software
The best customer service dashboard software: 8 tools compared for help desk teams
Eight ways to put tickets, response times, CSAT and agent activity on a live dashboard: the reporting built into Zendesk, Freshdesk, HubSpot and Intercom, plus Plecto, Geckoboard, Databox and Power BI, compared on refresh speed, integrations, TV screens and gamification.
What is the best customer service dashboard software?
Written by Plecto. Competitor details reflect each vendor's public documentation in November 2026; check their sites for current plans and prices.
The best customer service dashboard software depends on where your tickets live and who needs to see the numbers. Native help desk reporting suits analysis inside one tool. Plecto suits live KPI screens, combined data sources and agent motivation. Power BI suits deep analysis across the company.
This guide compares customer service dashboard software for help desk and ticket-based support: email, chat, tickets, CSAT, NPS and customer retention. If your team mainly takes phone calls, see the call center dashboard software comparison instead. The quick verdict:
- Native reporting in your help desk (Zendesk Explore, Freshdesk Analytics, HubSpot Service Hub, Intercom reporting) if your team lives in one system and the people who read the numbers are already logged in.
- Plecto if you want customer support dashboards on office TVs and phones, with targets, leaderboards and contests, and the option to combine your help desk with phone and CRM data. It connects to 150+ systems, including Zendesk Support, Freshdesk, Intercom, Help Scout and HubSpot.
- Geckoboard or Databox if you want a lighter KPI screen or flexible custom metrics on top of your help desk.
- Power BI if a BI team wants support data joined with the rest of the company in one governed model.
Plecto is not a help desk, a BI warehouse or a survey tool. It reads data from your help desk through integrations and turns it into live KPIs and motivation, so the help desk's own reports can still go deeper on a single ticket field.
Customer service dashboard software at a glance
How eight tools differ on refresh, integrations, TV screens and gamification.
| Tool | Best for | Real-time and refresh | Help desk integrations | TV and office screens | Gamification |
|---|---|---|---|---|---|
| Plecto | Live support KPIs with targets, TVs and agent motivation | 2-minute imports; 10-second streaming for live agent status (Zendesk); Intercom conversation updates via webhooks | Zendesk, Freshdesk, Intercom, Help Scout, Dixa, HubSpot, ServiceNow and more | Unlimited TVs through slideshows | Leaderboards, achievements, coins and reward store; contests on Large and Enterprise |
| Zendesk Explore | Analysis of Zendesk tickets, voice, chat and messaging | Historical data daily (Lite) or hourly (Professional, Enterprise); live dashboard near-real-time for existing users | Zendesk products, plus supported third-party data | Not described in Zendesk's refresh and live dashboard articles | Not described on the pages reviewed |
| Freshdesk Analytics | Curated and custom reports inside Freshdesk | Not stated on the pages reviewed | Freshdesk | Not mentioned on its reporting page | Not mentioned on its reporting page |
| HubSpot Service Hub | Service reports next to CRM data in HubSpot | Roughly 2-3 minutes for CRM object data and 5 minutes for event data | HubSpot | Full screen view for dashboards | Not described on the pages reviewed |
| Intercom reporting | Chat-first teams on Intercom | Real-time dashboard inside the Inbox | Intercom | Not mentioned on its reporting page | Not mentioned on its reporting page |
| Geckoboard | Simple live KPI screens for small teams | Zendesk support widgets every 10 minutes; agent status every 30 seconds | Zendesk, Freshdesk, Intercom, Help Scout, Gorgias, HubSpot Service Hub | Built for TVs and wallboards, Slack and Teams | Agent leaderboards and goal tracking |
| Databox | Custom metrics across support, sales and marketing | Daily on the free plan, hourly on paid plans, 15 minutes as an add-on for selected sources | Intercom template; HubSpot Service connection | Not mentioned on its support tools page | Goals and OKRs; no contests |
| Power BI | Modeled analysis across the whole company | 8 scheduled refreshes a day on shared capacity, 48 on Premium | Zendesk Data connector (beta); others through connectors or a warehouse | Not its focus | Not its focus |
How we evaluated these tools
We picked the customer service dashboard software that top search results and AI assistants most often name, then checked each claim on the vendor's own site or documentation. We compared them on six questions that matter to a support lead:
- Refresh speed: can a number on the wall be trusted to be current, or is it an hour old?
- Your help desk: does it read the exact system your agents work in?
- Combining data: can tickets sit next to phone, CRM or billing data on one screen?
- Visibility: does it work on a TV, in Slack or on a phone, or only in a browser tab?
- Motivation: does it give agents targets, leaderboards and rewards, or only charts?
- Setup: how much work before the first useful dashboard?
We list no competitor prices. Where a vendor's page does not say something, the table says so rather than guessing.
The best customer service dashboard software, reviewed
1. Plecto: customer service dashboard software for live KPIs and motivation
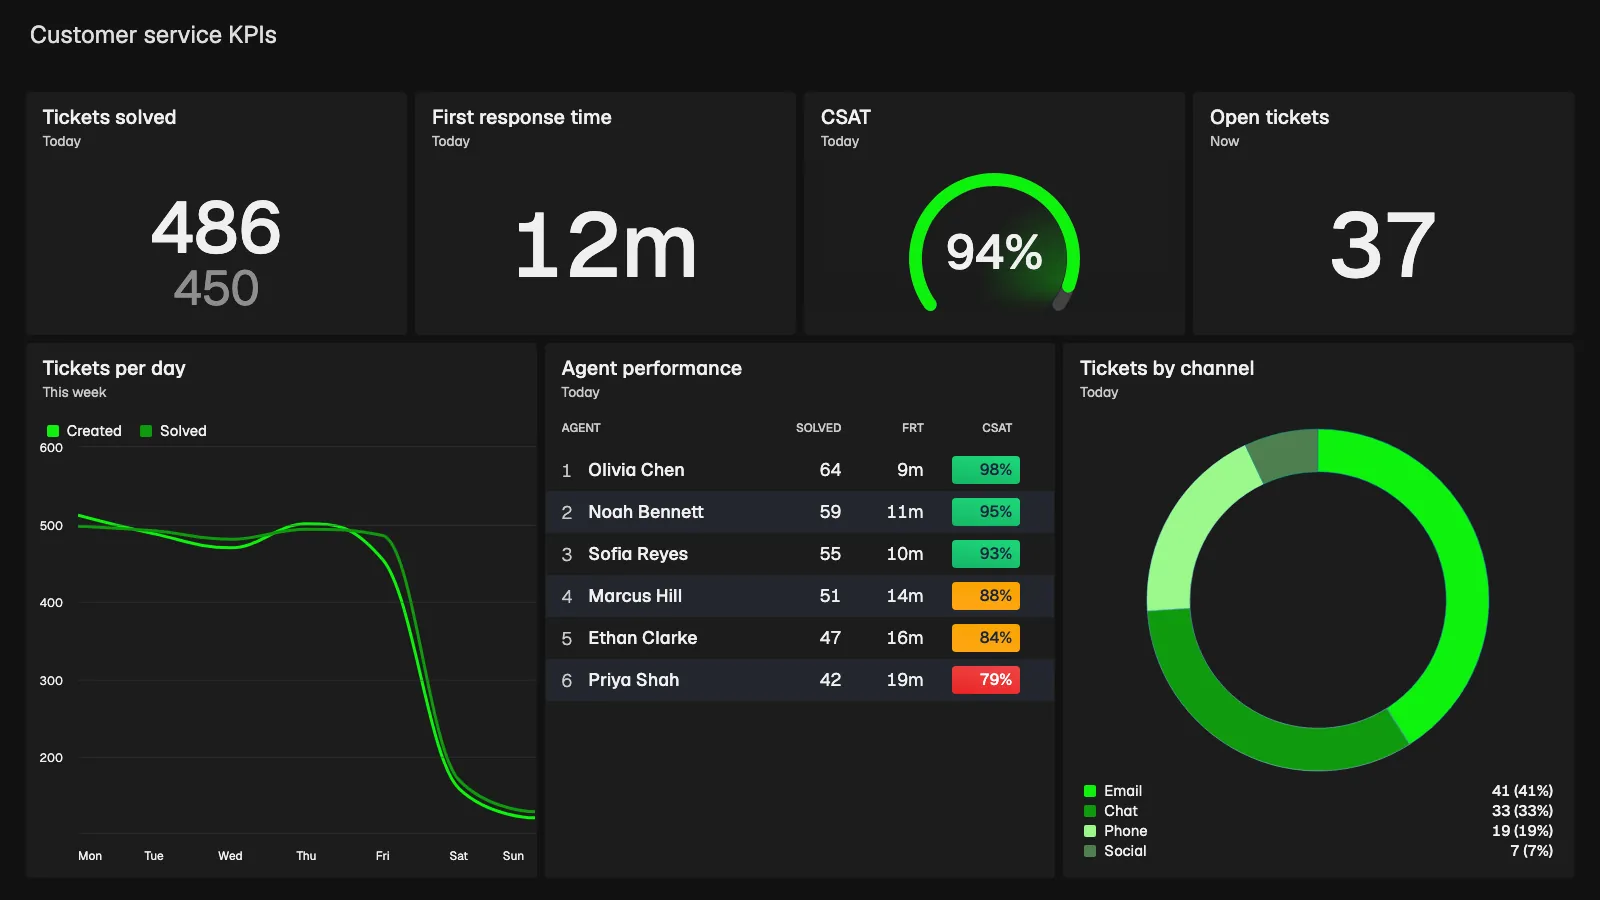
Plecto is a performance management platform that turns support data into real-time KPI dashboards, contests and coaching that motivate teams. For help desk teams it is the layer that puts tickets, response time and CSAT on a TV, shows each agent their own numbers and ties them to targets.
- Best for: support and CX teams that use more than one system, and managers who want agents to see and react to their own numbers, not only team leads.
- Strengths: the Zendesk Support integration imports tickets, events, satisfaction ratings and calls every 2 minutes, and streams metrics such as live agent status every 10 seconds. Freshdesk tickets and satisfaction ratings import every 5 minutes. Intercom conversation parts and ratings update instantly through webhooks, with a 1-minute check as backup. Help Scout and HubSpot tickets are supported too, and you can add 150+ other systems next to them. Conditional colors turn a widget red, yellow or green against your target, dashboards run on unlimited TVs at no extra cost, and every plan has unlimited dashboards and data sources.
- Limits: not a help desk, survey tool or BI warehouse. Most help desk data refreshes every few minutes rather than instantly, contests and the Reward Store are on the Large and Enterprise plans, and the 10-license minimum can cost more for very small teams.
- Pricing: Medium from $24 and Large from $37.20 per license per month, billed yearly. Enterprise is custom. 14-day free trial, no credit card required. See pricing.
- More: customer service dashboard examples, the Zendesk dashboard page and customer service gamification.
2. Zendesk Explore: native analytics for Zendesk teams
Zendesk Explore is the reporting and analytics tool for Zendesk products, and the natural first stop if your agents already work in Zendesk.
- Best for: analysts and managers who want to dig into Zendesk ticket, voice, messaging and chat data without another tool.
- Strengths: Zendesk's help center describes a prebuilt live dashboard with sections for support, voice, messaging and chat, including tickets created and solved in the last 30 minutes, calls in queue and wait times. Its live metrics refresh in near-real time, typically every 5 to 10 seconds. Zendesk also says its analytics can use supported third-party business data next to Zendesk data.
- Limits: historical data refreshes daily on Explore Lite and hourly on Professional and Enterprise. The live dashboard needs at least Suite Professional, is only available to users who accessed Explore before May 5, 2026, and Zendesk is removing live reporting from Explore on January 25, 2027, with real-time monitoring replacing it. Check which live view your account gets.
- Pricing: see the vendor's pricing page.
- Plecto on top: keep Zendesk as the system of record and add a TV and motivation layer; see the Zendesk dashboard guide.
3. Freshdesk Analytics: curated and custom reports
Freshdesk Analytics is the reporting area inside Freshworks' help desk, with ready-made curated reports and custom reports.
- Best for: Freshdesk teams that want standard help desk reports without extra tools.
- Strengths: Freshworks' reporting page describes custom dashboards for agent availability, case volumes and SLA performance, a curated set of pre-built reports and the option to build reports from scratch with filters and visualization widgets.
- Limits: per Freshdesk's help article, curated reports require a Growth plan or higher, only Ticket Volume Trends is listed for the free plan, and reports such as Agent Performance and Ticket Lifecycle need Pro or Enterprise. The pages reviewed do not describe refresh speed, TV display or gamification.
- Pricing: see the vendor's pricing page.
- Plecto on top: Plecto's Freshdesk integration imports tickets and satisfaction ratings every 5 minutes and also connects other Freshworks tools such as Freshsales and Freshservice.
4. HubSpot Service Hub: service reports next to CRM data
HubSpot Service Hub includes service analytics that sit alongside your HubSpot CRM records.
- Best for: teams that run support in HubSpot and want ticket reports next to contacts, companies and deals.
- Strengths: HubSpot's knowledge base lists customer satisfaction, team performance (time to close, time to first response, chat wait time, support volume by user), ticket reply and planning reports, with SLA-hours views for response and close times. It says CRM object data refreshes in about 2 to 3 minutes and event data in about 5 minutes. Service reports are available on Service Hub Starter, Professional and Enterprise.
- Limits: only Help Desk messages such as chat and email replies are counted in reply reports, and some ticket reports show only the top ten tickets or customers. HubSpot's own reports are built for analysis, so check how a wall-mounted screen would stay current. There are no contests or leaderboards built for the floor.
- Pricing: see the vendor's pricing page.
- Plecto on top: Plecto's HubSpot integration imports tickets every 2 minutes and deals instantly through webhooks, so support and sales can share a screen. See HubSpot dashboard tools compared.
5. Intercom reporting: live and custom reports for chat-first support
Intercom reporting covers conversations, response times and CSAT for teams that support customers mainly through messaging.
- Best for: chat-first teams on Intercom that manage live conversations from the Inbox.
- Strengths: Intercom's real-time dashboard shows conversation volume across inboxes (open, unassigned, waiting for first reply), end-user wait time, SLA miss rate, first response time, CSAT and individual teammate metrics. Its reporting page lists advanced custom reports with custom charts, progress targets and filters, plus CSV export.
- Limits: Intercom's help center says custom CSAT charts need the Advanced or Expert plan. Reports cover Intercom data, so a view that includes billing or CRM data needs another tool. TV display and gamification are not described on the reporting page.
- Pricing: see the vendor's pricing page.
- Plecto on top: the Intercom integration brings conversations and ratings into Plecto, with agents, activity logs and custom data on a 1 to 2 minute schedule.
6. Geckoboard: simple live KPI screens
Geckoboard is KPI dashboard software that shows live business data on TVs, Slack, Microsoft Teams and mobile.
- Best for: small support teams that want a few live numbers on a TV with little setup.
- Strengths: its customer service page names Zendesk, Freshdesk, Intercom, Help Scout, Gorgias, HubSpot Service Hub and Aircall among 90+ integrations, and describes alerts to Slack or Teams when a metric crosses a threshold, goal tracking and agent leaderboards. Its Zendesk Support data source lists metrics such as first reply time, CSAT, SLA achievement rate and tickets nearing SLA breach.
- Limits: per its Zendesk page, support widgets refresh every 10 minutes, with messaging metrics instant and agent status widgets every 30 seconds. It lists leaderboards and goals, but no contests or coaching.
- Pricing: check Geckoboard's pricing page.
- Compare: Plecto vs Geckoboard
7. Databox: custom metrics across support and other data
Databox is a business analytics tool that combines metrics from many sources into dashboards, reports and goals.
- Best for: teams that want support metrics next to marketing, sales or product data in one reporting view.
- Strengths: its customer support tools page offers a free plug-and-play support dashboard template for Intercom, and it advertises 130+ connected tools plus Goals and OKRs. Databox also lists a HubSpot Service connection.
- Limits: per its pricing page, the free plan syncs daily and paid plans sync hourly at most, with a 15-minute sync as an add-on for selected sources. That makes it a reporting tool rather than a live wallboard. Contests and leaderboards are not its focus.
- Pricing: check Databox's pricing page.
- Compare: Plecto vs Databox
8. Power BI: deep analysis across the company
Power BI is Microsoft's business intelligence platform for modeling data and building reports.
- Best for: BI teams that want support data joined with finance, product and CRM data in one governed model.
- Strengths: deep modeling, custom measures and a large report ecosystem. Microsoft lists a Zendesk Data connector, owned and provided by Zendesk, which is labeled beta.
- Limits: import-mode models refresh on a schedule: up to 8 times a day on shared capacity and up to 48 on Premium, PPU or Fabric capacity. It is built for analysis, not for an agent-facing TV with targets and contests, and other help desks need a third-party connector or a data warehouse in between.
- Pricing: see Microsoft's Power BI pricing page.
- Compare: Plecto vs Power BI
Which customer service KPIs should the dashboard track?
A good support dashboard shows speed, quality and workload together, so a fast team does not hide unhappy customers. Start with these:
First response time
How long customers wait for the first reply. The first number agents can influence directly.
CSAT
The share of customers who rate an interaction as good, collected after a ticket or chat.
Net promoter score
How likely customers are to recommend you, a relationship measure rather than a ticket measure.
Ticket backlog
How many tickets are waiting. Pair it with the oldest unanswered ticket to see where the queue is stuck.
For formulas and more examples, see 10 KPIs for customer service and the customer service KPI dashboard examples.
Real-time customer support dashboards vs reporting tools
Teams often ask which tools are best for creating real-time customer support dashboards. The honest answer is that two different jobs hide behind that question:
- Operational dashboards answer "what should we do in the next hour?" They need data that is minutes old at most, targets with colors, and a screen people can read from across the room. Plecto, Geckoboard and the live views in Zendesk and Intercom are built for this.
- Reporting and analysis answer "what happened last quarter and why?" Hourly or daily refresh is fine, and flexible slicing matters more than a TV. Native help desk reports, Databox and Power BI are built for this.
Most teams need both, and they are not rivals. Use your help desk's reports or a BI tool for analysis, and live customer service dashboard software for the floor. Ask every vendor how often a number refreshes, because "real time" on a marketing page can mean anything from 5 seconds to an hour. The table above shows the figures each vendor publishes.
Customer service dashboards that integrate with your CRM
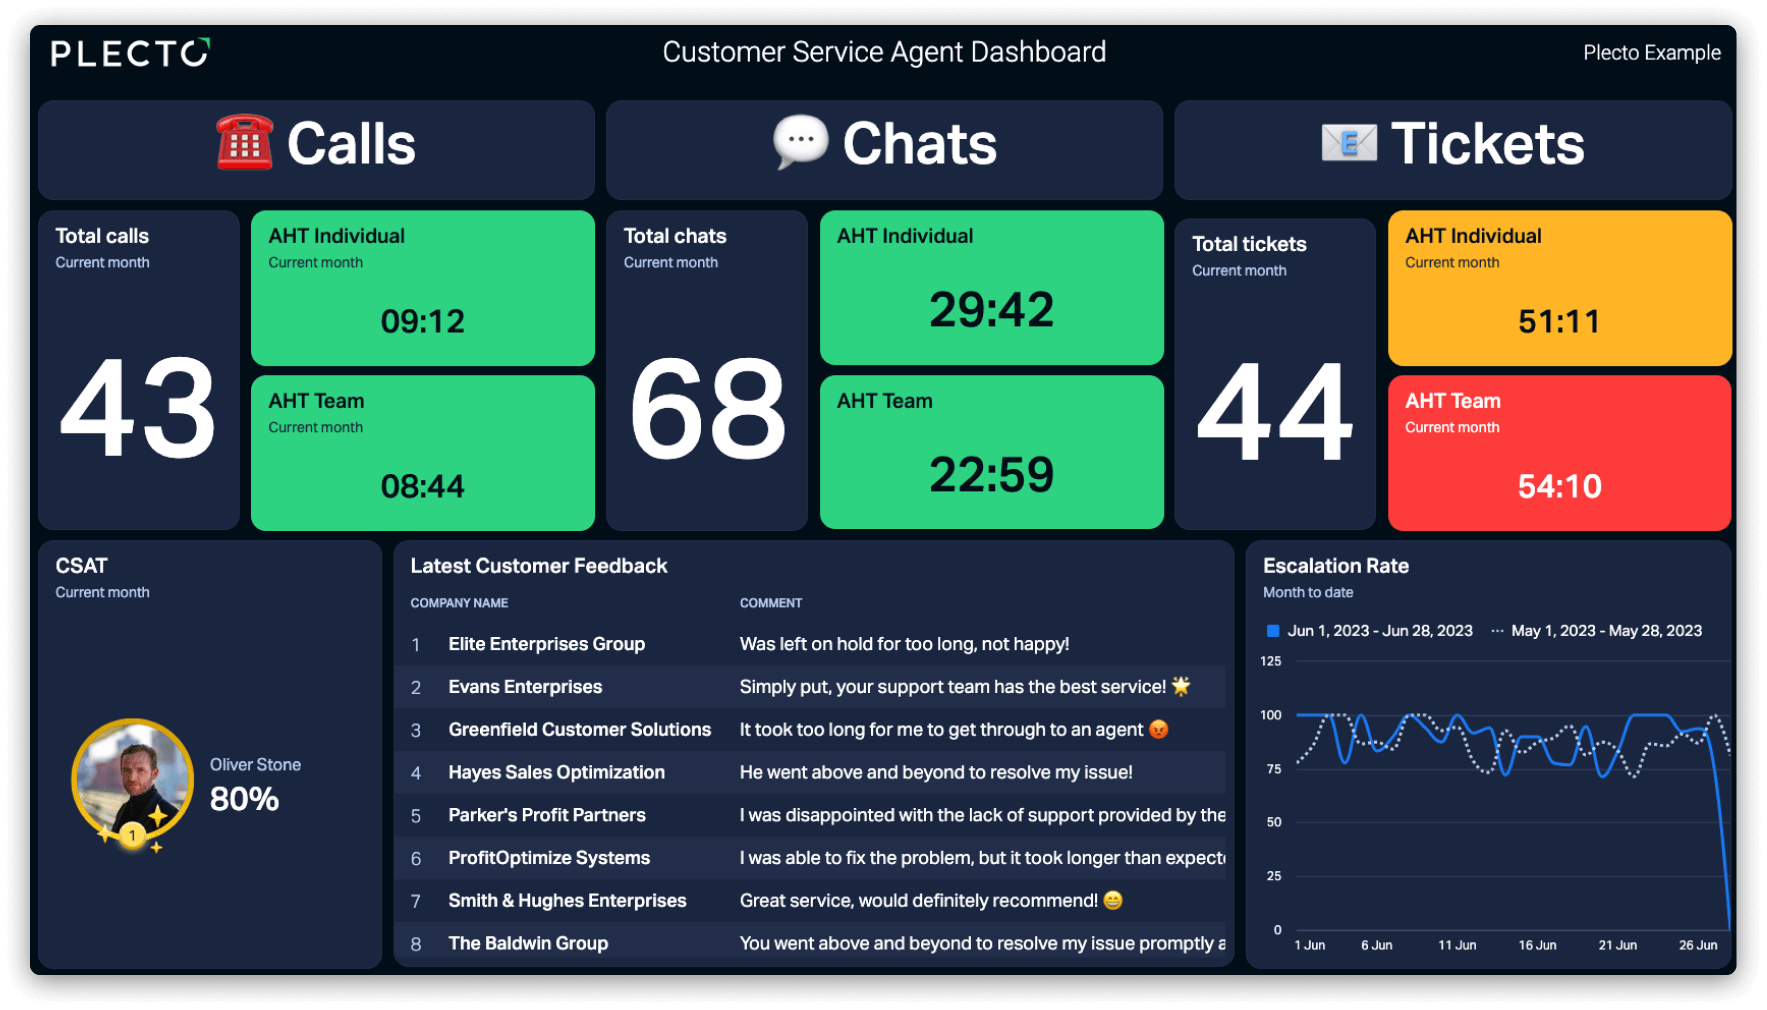
Customer retention dashboard software has to read more than tickets. Churn risk shows up when support load, satisfaction and account data sit side by side: a customer with falling CSAT, rising open tickets and a renewal next month needs a call, not a report. That means the dashboard has to read your help desk and your CRM.
- Plecto reads support data from Zendesk, Freshdesk, Intercom and Help Scout, and CRM data from Salesforce and HubSpot, so a retention view such as churn, NPS and customer lifetime value can share a dashboard with ticket KPIs. See the customer retention dashboard examples.
- HubSpot Service Hub is the simplest option if your CRM and help desk are both HubSpot, because service reports and CRM records live in the same system.
- Geckoboard and Databox connect to HubSpot and to several help desks, with the refresh limits listed above.
- Power BI fits best when churn analysis needs billing and product usage data in a model.

Gamification for customer service teams
A dashboard that only shows numbers rarely changes behavior. Gamification adds a visible goal, a fair ranking and a reward, and of the tools above Plecto is the one built around it. Its leaderboards, achievements, coins, contests and reward store run on the same live ticket and CSAT data as the dashboards.
Geckoboard lists agent leaderboards and goal tracking, which cover visibility but not contests or rewards. The native help desk tools and Power BI do not describe gamification on the pages we reviewed.
A support-specific example: run a weekly contest on CSAT rather than tickets closed, so speed does not beat quality, and show the leaderboard on the team TV. See customer service gamification for setups that work.
Which tool fits your use case?
Analysis inside one help desk and live screens across systems are different jobs.
| Use case | What to look for | Tools to shortlist |
|---|---|---|
| Analysis inside the help desk you already use | Reports on your own ticket fields, no extra tool | Zendesk Explore, Freshdesk Analytics, HubSpot Service Hub, Intercom reporting |
| KPI metric tracker for customer support teams | Targets, trends, team and agent views without a BI project | Plecto, Geckoboard |
| Visualize customer experience KPIs in real time | Fresh data, colors against targets, CSAT and NPS beside ticket speed | Plecto (customer satisfaction dashboards), Geckoboard |
| Real-time dashboards for B2B customer service teams | Account-level view, CRM data next to tickets | Plecto, HubSpot Service Hub if you are on HubSpot |
| Dashboard tool for Zendesk support metrics | Zendesk tickets, ratings and agent status; ideally on a TV | Zendesk Explore, Plecto (Zendesk dashboard), Geckoboard |
| Customer retention dashboard with CRM data | Support, CRM and satisfaction data on one screen | Plecto, HubSpot Service Hub, Power BI |
| Customer service gamification | Contests, leaderboards, rewards on live data | Plecto; Geckoboard for leaderboards only |
| Company-wide modeled analysis | Governed data model, custom measures | Power BI |
How to choose a customer service dashboard
- Name the job. Live floor screen, analysis, or retention reporting: the job decides which customer service dashboard software fits. Do not buy a BI tool for a wallboard.
- List your systems. Help desk, phone system, CRM, survey tool. Check the vendor's integration list for each, and the Plecto integrations list if you are shortlisting Plecto.
- Ask for the refresh rate in writing. Numbers from the table are a starting point; plans and data types change them.
- Decide who looks at it. Managers in a browser, or agents on a TV and phone.
- Decide if you need motivation. If agents influence the numbers, gamification is part of the tool, not an extra.
- Run a trial on your own data. Connect your help desk and build one dashboard before you commit.

“The impact of Plecto can be seen in daily interactions, where there are employees pointing to the dashboard screen and saying, ‘Hey, you’re up there on the leaderboard’ to a colleague or laughing at the YouTube videos. This has definitely led to an increase in happiness to be at work.”

Emil Gjørup Pedersen
Performance Specialist, Telmore
Customer service dashboard FAQ
Look for live KPIs with targets, team and agent views and a TV or mobile display. Plecto covers first response time, resolution time, CSAT and ticket volume from Zendesk, Freshdesk, Intercom and other help desks, and adds gamification on the same data. Geckoboard is a simpler KPI screen. A BI tool such as Power BI fits deeper analysis better.
Tools that read your help desk and survey data and refresh in minutes, such as Plecto and Geckoboard, work for live screens. Zendesk and Intercom also offer live views for their own data. Plecto's customer satisfaction dashboards show CSAT, NPS and customer effort next to ticket speed.
B2B teams need account context, so the dashboard should read both the help desk and the CRM. Plecto combines Zendesk, Freshdesk or Intercom with Salesforce or HubSpot data on one screen. If you run support and sales entirely in HubSpot, Service Hub reports are the simplest start, though they are built for analysis more than for wallboards.
For live team performance, Plecto and Geckoboard. For analysis inside one help desk, Zendesk Explore, Freshdesk Analytics, HubSpot Service Hub or Intercom reporting. For modeled analysis across the company, Power BI. The best choice depends on whether the dashboard is for the floor, for managers or for analysts. See the customer service dashboard overview.
Plecto and Geckoboard are built for live support screens, and the live views inside Zendesk and Intercom cover their own data. Plecto imports Zendesk tickets every 2 minutes, streams live agent status every 10 seconds and shows the result on unlimited TVs. Geckoboard refreshes Zendesk support widgets every 10 minutes. Reporting tools such as Databox and Power BI refresh hourly or on a schedule.
Zendesk Explore is the native choice and the strongest for analysis. If you want Zendesk next to phone, CRM or other data on an office TV, with targets and contests, Plecto's Zendesk Support integration imports tickets and ratings every 2 minutes. Geckoboard also lists a Zendesk integration. See the Zendesk dashboard guide.
Plecto reads Salesforce and HubSpot alongside help desks such as Zendesk, Freshdesk and Intercom, so churn, NPS and ticket KPIs can share a dashboard. HubSpot Service Hub works if your CRM is HubSpot, and Power BI suits churn analysis that needs billing or product data. See the retention dashboard examples.
Plecto is built around gamification: leaderboards, achievements, coins, a reward store and contests on live ticket and CSAT data, with contests on the Large and Enterprise plans. Geckoboard lists agent leaderboards and goal tracking. The native help desk reports and Power BI do not describe gamification on the pages we reviewed. See customer service gamification.
Plecto imports HubSpot deals instantly through webhooks and other HubSpot data every 2 minutes, plus Zendesk tickets and ratings every 2 minutes. Geckoboard connects to both, with HubSpot refreshing every 10 minutes as standard and Zendesk support widgets every 10 minutes. Power BI lists a Zendesk connector but needs another route for HubSpot.
Try Plecto free for 14 days.
No credit card required.