 Sign in

Shopify dashboard examples: live store KPIs for your whole team
Turn Shopify orders, products, refunds and customers into a live dashboard your team can see on a TV, with targets and notifications.

What is a Shopify dashboard?
A Shopify dashboard is a visual summary of your store data, such as orders, revenue, products, refunds and customers. Shopify has its own Analytics and Live View inside the admin. A live Shopify dashboard in Plecto puts store activity on a TV, next to support, CRM and finance data, with targets and notifications.
Most people searching for a Shopify dashboard want the one inside their Shopify admin, and it is the right place to run the store. This page covers both: what Shopify's own tools show, and how teams build a team-wide view that everyone can see. Plecto connects through a Shopify integration that is currently in beta, which means it is subject to change based on testing and your feedback.
Written by Plecto. Competitor details reflect each vendor's public documentation in November 2026; check their sites for current plans and prices.
Shopify's built-in dashboard: Analytics and Live View
According to Shopify's help center, reporting in the admin has three parts:
- Analytics dashboard. A customizable page of metric cards, each showing a quick value such as net sales by channel. Every card links to a matching report.
- Reports. Found under Analytics > Reports, with a visualization and a detailed table for each metric. You can customize a report to explore the data, and a custom report adds a card to the dashboard library.
- Live View. A world map and 3D globe of store activity. Per Shopify's Live View documentation, it shows visitors right now, total sales, sessions, orders, top locations and top products, plus how many customers have active carts, are checking out or have purchased. It requires the Online Store sales channel.
Main features are available on any Shopify plan, and staff need Analytics permissions to open them. For one store owner or marketer, that is a strong toolkit, and it includes storefront traffic, which Plecto does not import. What it is not built for is a shared wall screen that mixes Shopify with support tickets or sales pipeline and compares the numbers with targets your team sets. That is the gap a team dashboard fills.
When a Plecto Shopify dashboard helps
Plecto is a performance management platform that turns data into real-time KPI dashboards, contests and coaching. A Shopify dashboard in Plecto suits a store when more than one person needs to see the numbers.
- TV screens for the team. Put orders and revenue on a TV in the warehouse, customer service room or sales floor, using the Plecto TV app or a browser.
- Shopify next to other data. Combine store orders with tickets from Zendesk, deals from HubSpot, or ad data from Google Ads and Facebook.
- Targets and conditional colors. Set a daily or monthly target per KPI so a number turns green or red without anyone doing the math.
- Contests and notifications. Run a sales or support contest for store staff, or send a notification when something happens.
- Scheduled reports. Export reports to Excel or PowerPoint, or email them hourly, daily, weekly or monthly.
If you sell online and in stores, Plecto can also show Shopify beside POS or other e-commerce data. See Shopware, WooCommerce and Klaviyo for other e-commerce sources.
Shopify dashboard example: online store sales
The dashboard at the top of this page is built in Plecto on Shopify data. Its tiles show average basket size and average basket value month to date, products sold today, revenue month to date, partial refunds and the refund rate. Two line charts plot the value of orders and the number of products sold as a solid line over a dotted line for the previous period, so a slow week is obvious.
The mix works for a store manager: one glance tells you whether the month is tracking last month, and the refund tiles show returns before they become a surprise. Copy the layout: big tiles for today and month to date, trend lines underneath. Our store performance dashboard page shows the same idea across several stores.
Shopify KPIs dashboard: pre-built widgets
Pre-built widgets to start a Shopify dashboard
Plecto includes pre-built Shopify KPI widgets for the value of new orders, average basket size, average order value and products sold. They are a quick way to start a Shopify KPIs dashboard before you add your own formulas. Pick a widget, choose a period and a comparison, and place it on the dashboard.
From there, add the numbers specific to your store, such as refunds by reason or best-selling products. The e-commerce dashboard page shows more ways to lay them out.

Online and in-store: a Shopify dashboard beside POS sales
A physical store view to pair with online data
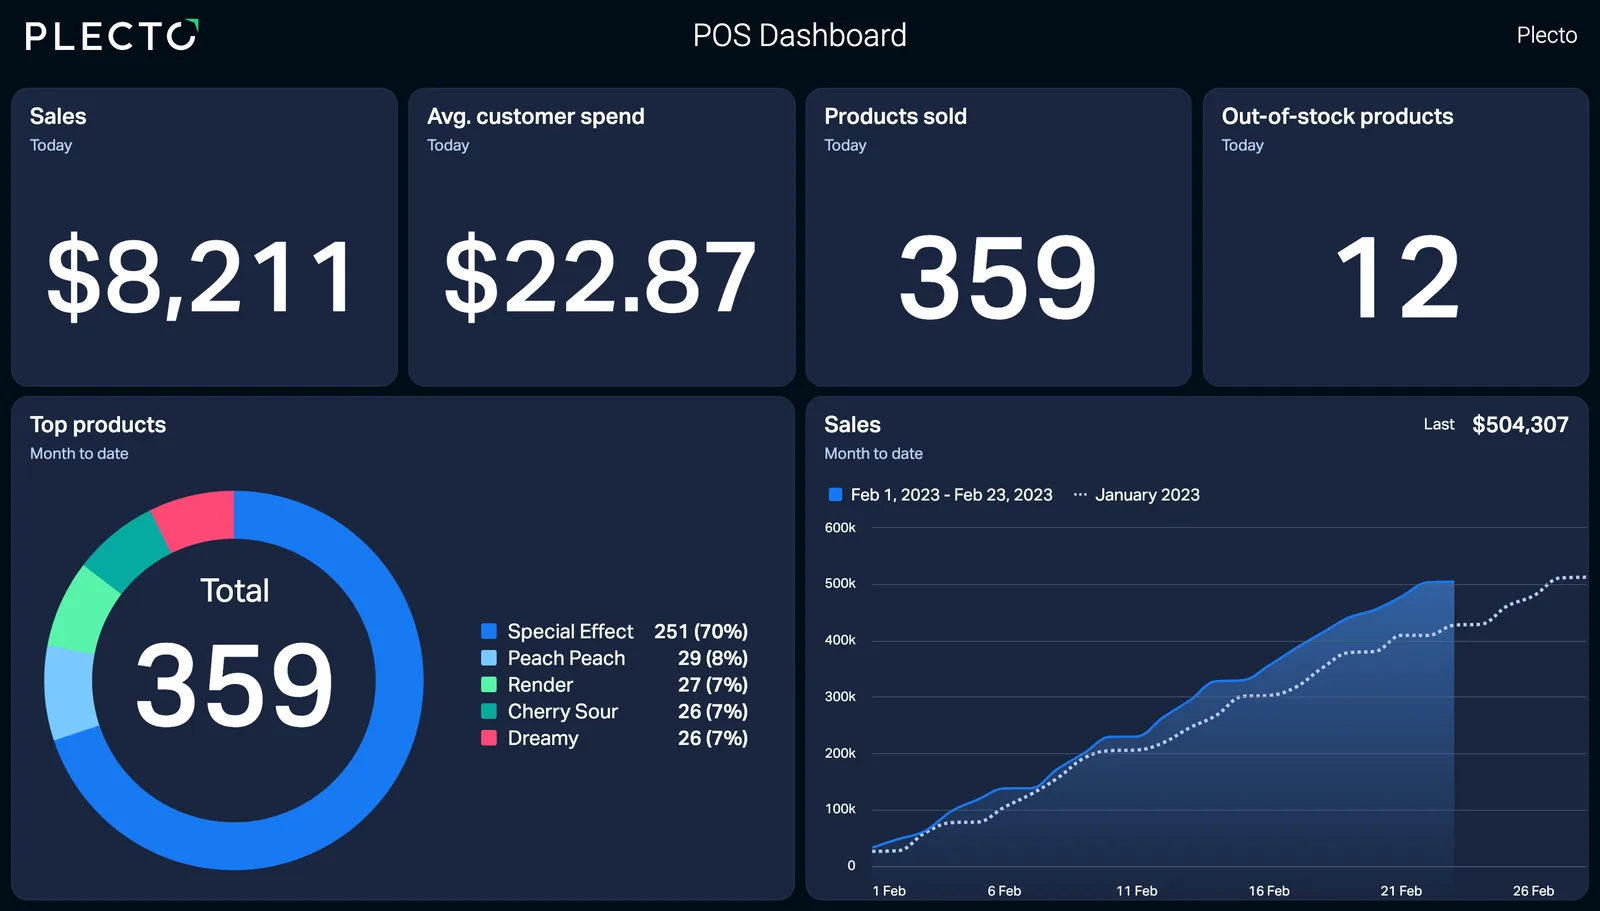
If you also run physical stores, give them their own live view. This example is a POS dashboard with sales today of $8,211, average customer spend of $22.87, 359 products sold and 12 out-of-stock products, plus a top products donut and a cumulative sales line chart. It is built on POS data, not Shopify data.
Put it next to your online dashboard in the same slideshow and the team sees both channels. Plecto connects to POS systems such as OnlinePOS and FlexPOS. See retail dashboards for the full picture.
Which KPIs belong on a Shopify dashboard?
Start with what Plecto can import today, then add the numbers only Shopify Analytics has.
Value of new orders and average order value
Revenue pulse and spend per order. Watch both: more orders with a lower value tells a different story.
Value of new refunds
Money paid back to customers. Put it in red against a limit so returns get attention.
Number of new customers
How many people signed up or bought for the first time in the period.
Repeat purchase rate
The share of customers who come back. A strong sign of loyalty beyond ad-driven traffic.
Cart abandonment rate
Carts started but not bought. Shopify Analytics tracks this; Plecto's Shopify data types do not include carts.
Inventory turnover
How fast stock sells through. Useful once inventory data sits on the same screen as sales.
Shopify KPIs: what Plecto can show and what only Shopify can
Use the table to decide which view each number belongs in. "Shopify Analytics only" means Plecto's Shopify data types do not contain the inputs.
| KPI | What it shows | Shopify data type in Plecto |
|---|---|---|
| Revenue and number of orders | Sales volume by day, week or month | Orders |
| Average order value | Spend per order | Orders |
| Products sold | Units sold, by product | Order Line Items |
| Refunds and refund rate | Money and items returned | Refunds, Refund Line Items, Order Adjustments |
| New customers | Customer growth | Customers |
| Stock levels | Inventory by item and location | Inventory Items, Product Variants |
| Sessions, visitors, conversion rate | Storefront traffic and how much of it buys | Shopify Analytics only |
| Cart abandonment | Carts left before checkout | Shopify Analytics only |
| Marketing attribution | Which channel drove a sale | Shopify Analytics only |
For more ideas, read our guides to e-commerce KPIs and ecommerce analytics, or browse KPI examples.
What data can a Shopify dashboard in Plecto use?
Plecto imports nine data types from Shopify. Most update every 2 minutes, Products every 5 minutes and Product Variants every 10 minutes. None support webhooks, so updates are scheduled, not instant. None support custom fields, and most support relations.
| Data type | Update frequency |
|---|---|
| Customers | 2 minutes |
| Inventory Items | 2 minutes |
| Order Adjustments | 2 minutes |
| Order Line Items | 2 minutes |
| Orders | 2 minutes |
| Refund Line Items | 2 minutes |
| Refunds | 2 minutes |
| Products | 5 minutes |
| Product Variants | 10 minutes |
The honest limits: the integration is in beta, and the data types above do not include sessions, traffic, carts or marketing attribution. For those, keep using Shopify Analytics or add Google Analytics as a separate source. Details are in the Shopify integration guide.
Show your Shopify dashboard on a TV
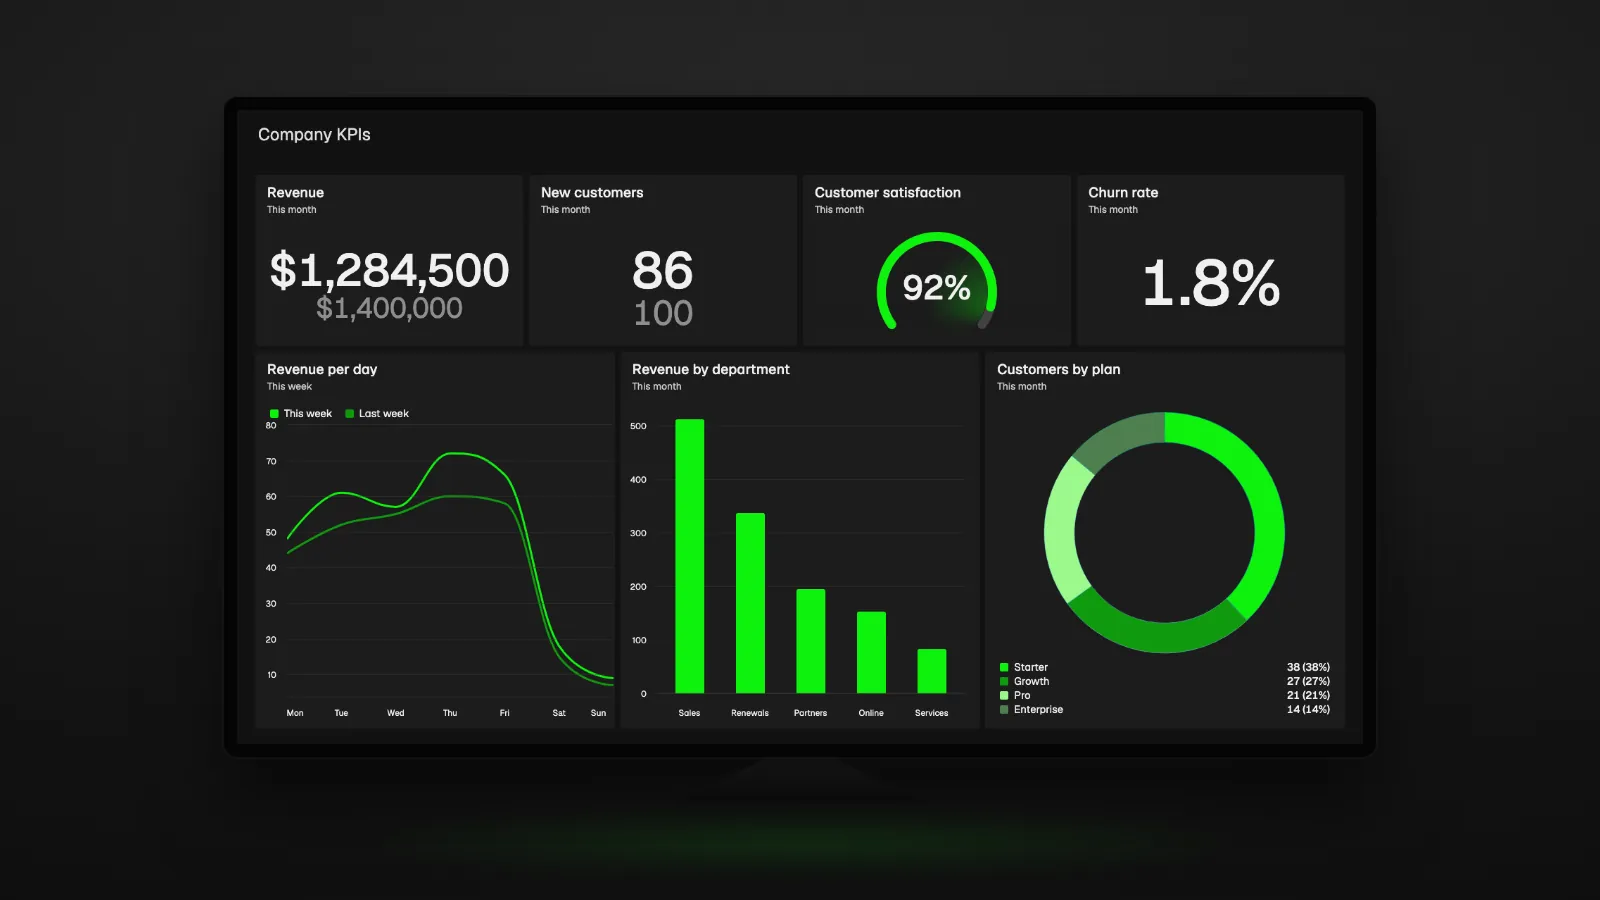
A number only helps if someone sees it, so put your Shopify dashboard where the team already looks. Add the dashboard to a Plecto slideshow and play it on an office or warehouse TV through the Plecto TV app or the TV's browser. The TV dashboards guide walks through the setup.
How to set up a Shopify dashboard in Plecto
- Create an app in Shopify. Under Settings > Apps and sales channels, choose Develop apps and create an app, for example named Plecto.
- Set read scopes. Enable read access for orders, customers, inventory, locations and products, then install the app.
- Copy the access token. Reveal it once and store it safely. Your subdomain is the part before .myshopify.com.
- Connect in Plecto. Add a Shopify data source, paste the subdomain and token, and choose the data types to import.
- Configure and import. Set the default date and fields, choose how much history to import, and click Import.
- Build the dashboard. Create formulas, add widgets with targets, and put the dashboard on a TV.
Plecto has a 14-day free trial with no credit card required.
Real-time Shopify dashboard options compared
The right tool depends on who needs the numbers. Shopify's own tools are the default for store operators, and a dedicated dashboard tool adds shared screens and other data sources.
| Option | Best for | Shopify data | Live / refresh | TV and team screens | Combine with other data |
|---|---|---|---|---|---|
| Shopify Analytics and Live View | Store owners and marketers | Full store analytics, including sessions and carts | Live View covers recent visitors and carts; totals since midnight | In the admin, not built for team screens | Shopify data only |
| Plecto | Teams that want targets, contests and TVs | Nine data types (orders, products, refunds, customers, inventory); no sessions or carts; beta | Every 2 to 10 minutes; no webhooks | Yes, TV app and slideshows | Yes, 150+ integrations |
| Geckoboard | Simple live KPI screens | Sales, orders and items | Within seconds of a new order, per its site | Yes, including office or warehouse TVs | Yes, 90+ data sources such as Google Analytics, Google Ads and Zendesk |
| Databox | Marketing and ecommerce reporting | Orders, sales, refunds, abandoned carts, customers, products | Default refresh not stated; 15-minute sync add-on for TV | Yes, TV dashboards | Yes, 130+ tools plus spreadsheets, databases and APIs |
Plecto's limits: beta status, scheduled updates, and no storefront traffic. See each vendor's site for current plans, and our best dashboard software comparison for a broader view.
Shopify dashboard FAQ
It is a visual summary of your Shopify store data, such as orders, revenue, products, refunds and customers. Shopify has its own Analytics dashboard, reports and Live View in the admin. Tools like Plecto show Shopify data live on TVs next to other business data, with targets.
Yes. Shopify's Live View shows visitors right now, orders, sales, sessions and customer behavior such as active carts, on a map and globe. It requires the Online Store channel, and some totals count from midnight store time. Analytics adds reports and a customizable metric dashboard.
It depends on the job. Shopify's Live View suits the store owner. Plecto fits teams that want Shopify orders and refunds on a TV with targets, contests and other data. Geckoboard and Databox also list Shopify integrations. Plecto's is in beta and updates every few minutes.
Shopify Analytics covers deep store reporting. For shared team screens, Plecto, Geckoboard and Databox each connect to Shopify. Plecto stands out for targets, contests and notifications on the same screen as Shopify, support and CRM data, but it has no storefront traffic data. See the comparison table above.
Connect Shopify to Plecto, build a dashboard with orders, revenue and refunds, and add it to a slideshow. Play the slideshow through the Plecto TV app or the TV's browser. Data refreshes every few minutes, so the screen stays current without anyone touching it.
Customers, Inventory Items, Order Adjustments, Order Line Items, Orders, Refund Line Items and Refunds update every 2 minutes. Products update every 5 minutes and Product Variants every 10. The integration has no webhooks, so updates are not instant, and it is in beta.
Start with revenue, number of orders, average order value, products sold, refunds and new customers, all available from Plecto's Shopify data. Conversion rate, sessions and cart abandonment come from Shopify Analytics, since Plecto's Shopify integration does not import traffic or carts.