 Sign in

Sales Productivity Metrics: 14 Ways to Measure Rep Output
Sales productivity metrics show how much revenue your reps produce for the time they invest. See 14 metrics with formulas and how to track them live.
Sales productivity metrics answer a question every sales manager gets asked: is the team getting enough out of the hours it puts in? Revenue alone does not answer it. A rep who closes a large deal after six months of work and a rep who closes five small ones in the same period can post the same number, with very different effort behind it.
This guide defines sales productivity, then walks through 14 metrics in four groups: activity, efficiency, pipeline and outcome. Each one comes with a formula and a note on what it tells you. If you want a broader list of KPIs first, start with our guide to 21 sales KPIs and come back here for the productivity angle.
What are sales productivity metrics?
Sales productivity metrics measure how much output a sales team produces for each unit of input, such as hours, headcount or outreach effort. They combine activity data (calls, meetings), speed data (response time, cycle length) and results (win rate, revenue per rep) to show where selling time turns into revenue and where it leaks.
The core idea is a ratio. Productivity is output divided by input. The input can be rep hours, number of reps, calls made or leads worked. The output can be meetings booked, pipeline created or revenue closed. Picking different pairs gives you different sales productivity metrics, and each pair answers a different question.
A sales KPI is a number you manage against a target. Productivity metrics are a subset of those KPIs, chosen because they link effort to results. Used together, they show whether a team is busy, efficient or effective, which are three different things.
How to measure sales productivity metrics
To measure sales productivity, pick one output, pick one input, and divide. Then track the result over time and compare it across reps, teams and segments. The four groups below cover the full path from effort to revenue:
- Activity metrics count the work reps do: calls, emails and meetings booked.
- Efficiency metrics show how well reps use their time: selling time ratio, lead response time and sales cycle length.
- Pipeline metrics show whether activity creates future revenue: pipeline created, coverage, stage conversion, win rate and sales velocity.
- Outcome metrics show the result: revenue per rep, quota attainment and average deal size.
Look at the groups in sequence. If activity is high but pipeline is thin, reps are working the wrong accounts or the wrong message. If pipeline is healthy but outcomes lag, look at win rate and cycle length. Data for most of these lives in your CRM, phone system and calendar, so the real work is getting it onto one screen.
Sales productivity metrics at a glance
The table summarizes all 14 metrics. Details and formulas follow in the sections below.
| Metric | Formula | Type | What to watch |
|---|---|---|---|
| Calls made per rep | Total calls ÷ selling days | Activity | Trend against target, paired with outcomes |
| Emails sent per rep | Emails sent ÷ selling days | Activity | Reply rate, not just volume |
| Meetings booked per rep | Meetings booked ÷ reps | Activity | Booked vs held |
| Selling time ratio | Selling hours ÷ total work hours | Efficiency | Admin and tool-switching time |
| Lead response time | First response time − lead creation time | Efficiency | Slow responses to new leads |
| Sales cycle length | Days from creation to close ÷ won deals | Efficiency | Deals stuck in one stage |
| Pipeline created | Value of new opportunities in period | Pipeline | Rep-level gaps in new pipeline |
| Pipeline coverage | Open pipeline value ÷ remaining quota | Pipeline | Coverage falling before quarter end |
| Stage conversion rate | Deals moving to next stage ÷ deals in stage | Pipeline | The stage where deals drop off |
| Win rate | Won deals ÷ (won + lost deals) | Pipeline | Win rate by rep and by source |
| Sales velocity | (Opportunities × win rate × avg deal size) ÷ cycle length | Pipeline | Which of the four inputs is weakest |
| Revenue per rep | Total revenue ÷ number of reps | Outcome | Spread between top and bottom reps |
| Quota attainment | Closed revenue ÷ quota × 100 | Outcome | Share of reps at or above quota |
| Average deal size | Total won value ÷ number of won deals | Outcome | Discounting and mix shifts |
Activity metrics: the input side of sales productivity metrics
Activity metrics are the cheapest of the sales productivity metrics to collect and the easiest to misuse. They tell you how much work is happening, not whether it works. Read them next to a pipeline or outcome metric, and see our guide to sales activity tracking for how to decide which activities are worth logging.
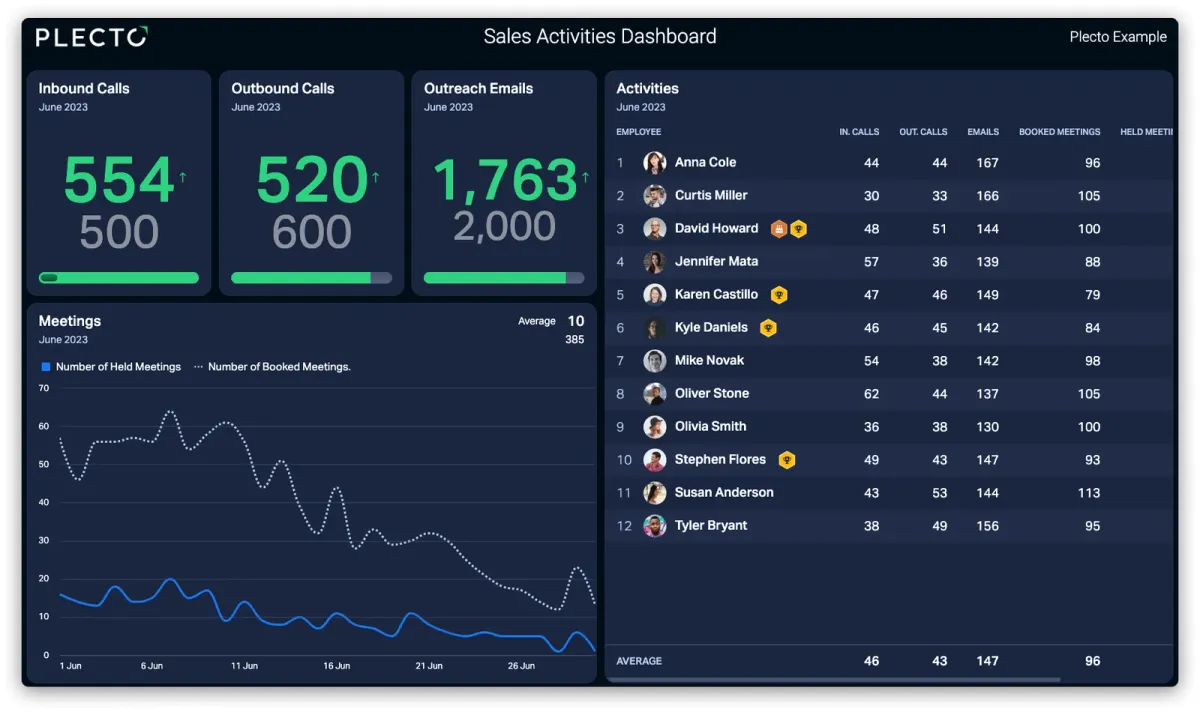
Calls made per rep. Formula: Total calls made ÷ number of selling days. Calls show outbound effort for teams that sell by phone. A rep with falling call volume and flat meetings booked may be getting more efficient. A rep with falling calls and falling meetings needs a conversation.
Emails sent per rep. Formula: Emails sent ÷ number of selling days. Pair it with reply rate (replies ÷ emails delivered × 100). High volume with a low reply rate usually means the targeting or the message is off, not that the rep needs to send more.
Meetings booked per rep. Formula: Meetings booked ÷ number of reps, plus a held rate of meetings held ÷ meetings booked × 100. This is the best activity metric for outbound and SDR teams because a meeting is the first outcome a buyer agrees to. A large gap between booked and held points to weak qualification or poor follow-up.
Efficiency sales productivity metrics: time and speed
Efficiency metrics show how much of a rep's day goes to selling and how quickly the team moves.
Selling time ratio. Formula: Time spent selling ÷ total working time × 100. Selling time covers prospecting, calls, meetings and deal work. Admin, internal meetings, data entry and tool-switching are the rest. Most teams cannot measure it precisely, so use calendar data, call logs and a short rep time survey as a starting estimate and track the direction rather than the exact number. A low ratio is often a process problem, not a rep problem.
Lead response time. Formula: Time of first rep response − time lead was created, averaged. Fast follow-up on new leads is a pure process metric, and it is easy to improve with routing rules and notifications. See the lead response time KPI for how to set it up.
Sales cycle length. Formula: Total days from opportunity creation to close ÷ number of won deals. A longer cycle ties up rep time in each deal, so shortening it raises productivity even if win rate stays the same. Track it by deal size and segment, because enterprise deals and small deals should not share one benchmark. The average sales cycle length KPI and our guide to the sales cycle go deeper.
Pipeline sales productivity metrics: does activity create revenue?
Pipeline metrics sit between activity and revenue, and they are the sales productivity metrics that best predict the quarter ahead.
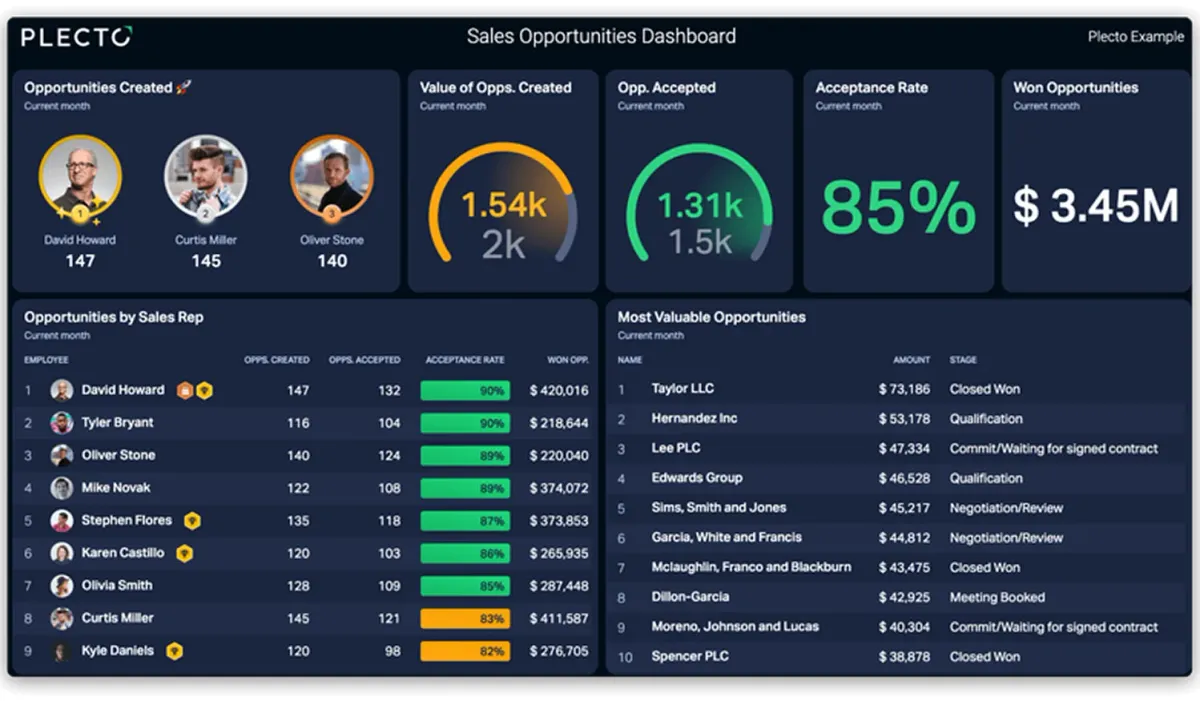
Pipeline created. Formula: Sum of the value of new opportunities created in the period. Track it per rep and per source. Pipeline created per rep shows who is generating their own opportunities and who is relying on inbound leads.
Pipeline coverage. Formula: Open pipeline value ÷ quota remaining. Teams often use a coverage target of several times the remaining quota because not every deal closes. Your own target should come from your historical win rate. For a probability-adjusted view, use weighted pipeline value.
Stage conversion rate. Formula: Deals that move to the next stage ÷ deals that entered the stage × 100. Calculate it for every stage. The stage with the sharpest drop is where coaching should focus. The sales conversion rate KPI covers the overall lead-to-sale version.
Win rate. Formula: Won deals ÷ (won deals + lost deals) × 100. Win rate is the clearest sign of how well a rep converts opportunities, and it is a core input to forecasting. Compare it by rep, source and deal size. See the win rate KPI for how Plecto defines it.
Sales velocity. Formula: (Number of opportunities × win rate × average deal size) ÷ sales cycle length. It shows how much revenue the pipeline produces per day, and it breaks productivity into four levers you can pull. Our sales velocity guide explains each lever.
Outcome sales productivity metrics: revenue, quota and deal size
Outcome metrics close the loop. These sales productivity metrics are lagging indicators, so use them to confirm what the earlier groups predicted.
Revenue per rep. Formula: Total revenue ÷ number of reps. The average hides spread, so also look at the gap between your top and bottom reps. If a few reps carry the number, the team has a coaching and territory question, not just a quota one.
Quota attainment. Formula: Closed revenue ÷ quota × 100. Track it per rep and as the share of reps at or above quota. If most of the team misses, check whether the quota is realistic before treating it as a performance problem.
Average deal size. Formula: Total value of won deals ÷ number of won deals. A rising average deal size with a falling win count can still mean flat revenue. Watch for discounting and mix changes. The average deal size KPI shows how to track it.
Common pitfalls when using sales productivity metrics
Metrics change behavior, so a badly chosen set of sales productivity metrics can make productivity worse. Watch for these five problems.
- Vanity activity metrics. Calls and emails are easy to inflate. If you reward volume alone, reps will make shorter, lower-quality calls. Always pair an activity metric with a result it should produce.
- Comparing reps without context. Territory quality, segment, tenure and lead source all change the numbers. A new rep still ramping up should not sit on the same scale as a veteran with a warm book of accounts.
- Relying on averages. A team average of 80 percent quota attainment can mean everyone is at 80 percent or half the team is at 40 and half at 120. Look at the distribution.
- Tracking too many metrics. Pick three to five per role. A rep who sees twenty numbers will not know which one to move.
- Bad data. Productivity metrics are only as accurate as CRM hygiene. If reps log calls late or skip fields, fix the process before you read anything into the trend.
How to track sales productivity metrics on a live dashboard
Spreadsheets and monthly reports work for finance, but they are too slow for sales productivity metrics that need weekly action. A live sales dashboard puts activity, pipeline and outcome numbers in one place, updated as reps work, so managers can act mid-week instead of mid-quarter.
Plecto turns sales data into real-time dashboards. Connect your CRM, such as Salesforce, HubSpot or Pipedrive, plus your phone system and spreadsheets, using one of 150+ integrations. Then build views by role:
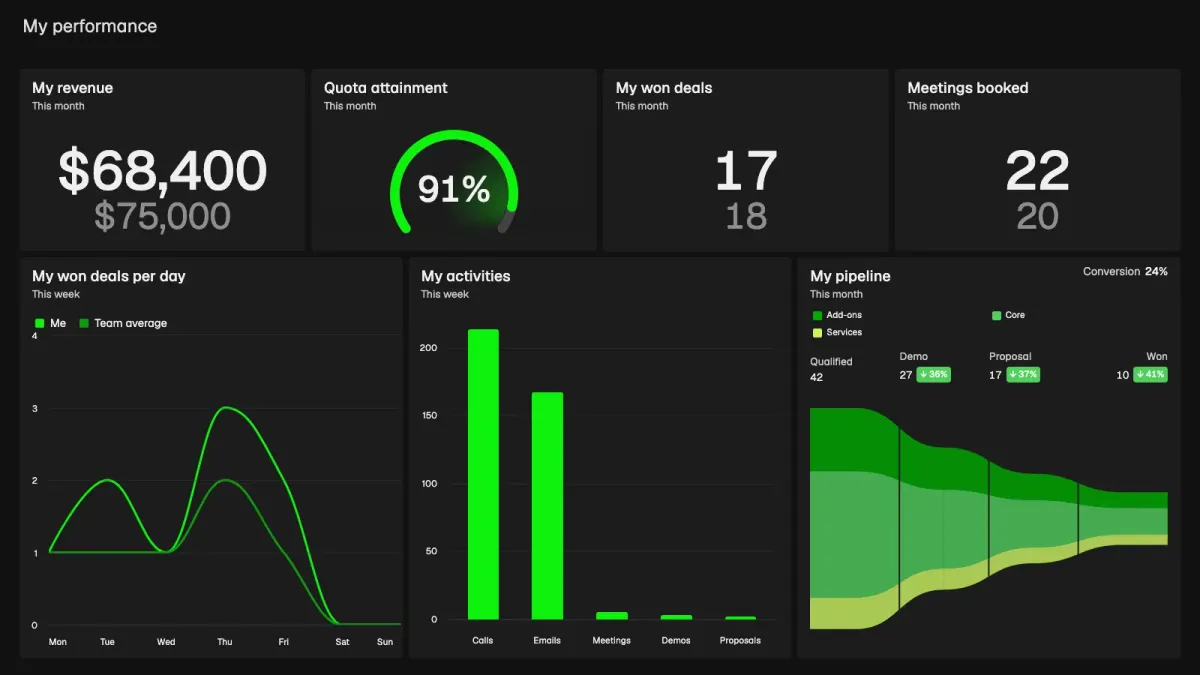
- A rep scorecard shows each rep their own revenue, quota attainment, activities and pipeline against targets and the team average.
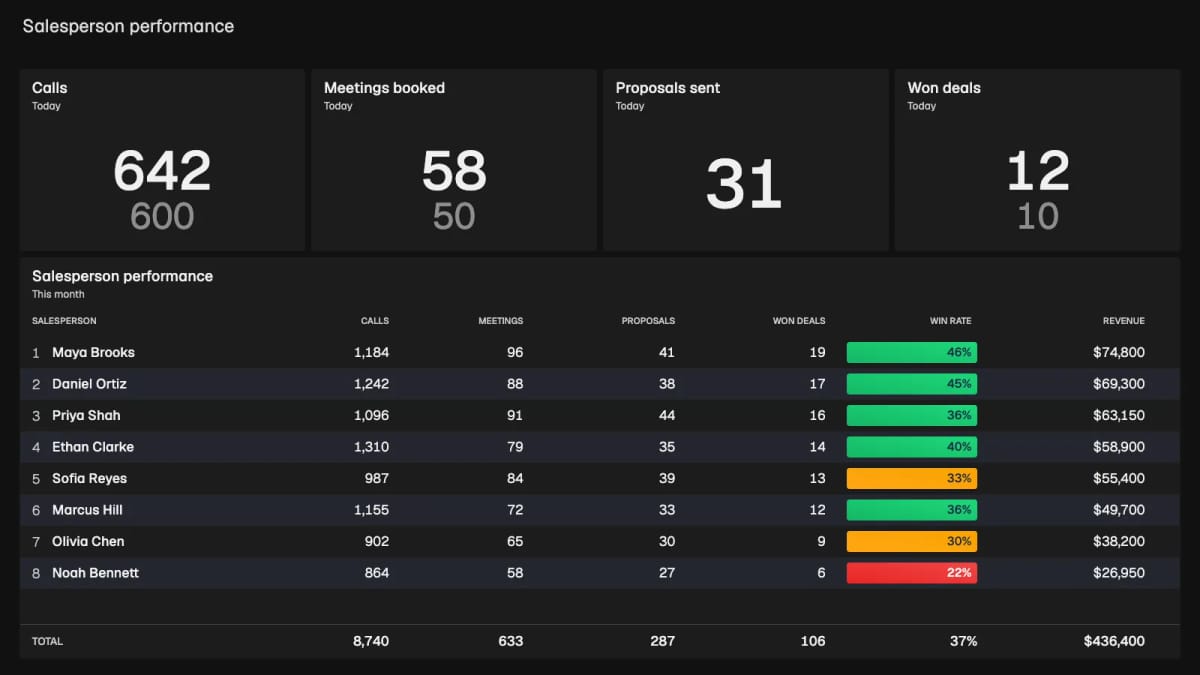
- A team table compares calls, meetings, proposals, won deals, win rate and revenue per rep in one view, with color coding against targets.
- A manager view tracks pipeline created, coverage and stage conversion to spot a weak quarter early.
Plecto also offers scheduled reports you can export to PowerPoint or Excel (available on the Large and Enterprise plans), so the same numbers reach people who do not open a dashboard. For ready-made layouts, see the sales performance dashboard examples or the pre-built sales KPI widgets.
Improve sales productivity metrics with leaderboards and coaching
Dashboards show where productivity stands. Two things move it: visibility and coaching.
A sales leaderboard turns a metric into a daily scoreboard. Rank reps on a result such as won deals or meetings held, not on raw call counts, so the incentive matches the outcome you want. Contests, available on Plecto's Large and Enterprise plans, add a time-boxed push on one metric, such as a week to lift meetings held.
Coaching handles the cases a leaderboard cannot fix. When the data shows a rep with strong activity and weak stage conversion, a coaching conversation about that stage is far more useful than another reminder to make calls. Plecto's one-on-ones, available on the Large and Enterprise plans, give each review a template and a log, so every conversation starts from the rep's own numbers and the next one can check progress. A practical rhythm is to review the team weekly, hold one-on-ones with each rep every two weeks, and revisit targets each quarter.
Sales productivity metrics: where to start
You do not need all 14 metrics on day one. Start with one from each group: meetings booked, sales cycle length, win rate and quota attainment cover effort, speed, conversion and results. Put them on one live dashboard, review them weekly, and add more only when a question needs it. Then see how Plecto fits your team with a 14-day free trial, no credit card needed.
Questions
Frequently asked questions about sales productivity metrics
There is no single best one, but win rate and revenue per rep are the most direct measures of output. Activity metrics matter only when they lead to pipeline and revenue. Pick one metric from each of the activity, efficiency, pipeline and outcome groups to get a balanced view.
Divide an output by an input. A common version is revenue per rep (total revenue divided by the number of reps). Other pairs include meetings booked per call, pipeline created per rep or revenue per selling hour. Choose the pair that matches the question you are asking.
Sales rep productivity metrics are the numbers you track for each individual salesperson: calls, emails, meetings booked, pipeline created, win rate, quota attainment and revenue. Compare them with the team average and with the rep's own trend, and account for territory, tenure and segment.
Review activity and pipeline metrics weekly, since they predict the month ahead. Review outcome metrics such as quota attainment and revenue per rep monthly, and revisit targets each quarter. A live dashboard lets managers spot problems between those reviews.
Find the weakest stage first. If selling time is low, cut admin work and tool-switching. If stage conversion drops at one step, coach on that step. If response time is slow, add routing and notifications. Leaderboards and one-on-ones keep the focus on the metric you want to improve.
Start your 14-day free Plecto trial today.
Enjoyed the article? Share it:


