 Sign in

Calendly dashboard examples: booked meetings and rep activity in real time
Turn Calendly events into a live dashboard your team sees on a TV, with meetings per rep, event types and upcoming bookings next to your CRM data.
What is a Calendly dashboard?
A Calendly dashboard is a visual summary of your Calendly scheduling data, such as events created, meetings completed and what is booked next. Calendly has its own analytics page. A live Calendly dashboard in Plecto puts the same activity on a TV next to CRM data, with targets and a leaderboard per rep.
Teams searching for a Calendly dashboard usually want one of two things: the reporting Calendly already includes, or a template they can put in front of the whole team. This page covers both. Plecto connects through its Calendly integration, and the examples below are demo dashboards built on example data with fictional people.
What Calendly's own analytics and reporting cover
According to Calendly's analytics help article, the Analytics dashboard is opened from the Profile dropdown and shows these widgets:
- Created events. How many events were booked in the period.
- Completed events. Meetings that took place, with trends over time.
- Rescheduled and canceled events. How often bookings change.
- Event distribution by duration, popular events and popular times. Which event types and time slots people pick.
You can filter by date range, user, team, group and event type, and export the data as CSV. Owners and admins see organization-wide data, while regular users see only their own. Calendly says owners and admins can track data up to one year, and access depends on your plan, so check Calendly's site for what your account includes. No-shows are marked on the Calendar page and appear in the Meetings CSV export.
That covers scheduling health well. What a built-in Calendly dashboard does not do is show booked meetings per rep against a target on a wall screen, or place meetings beside the deals they create in your CRM. That is where a live Calendly dashboard in Plecto helps.
Calendly dashboard example: created and completed events
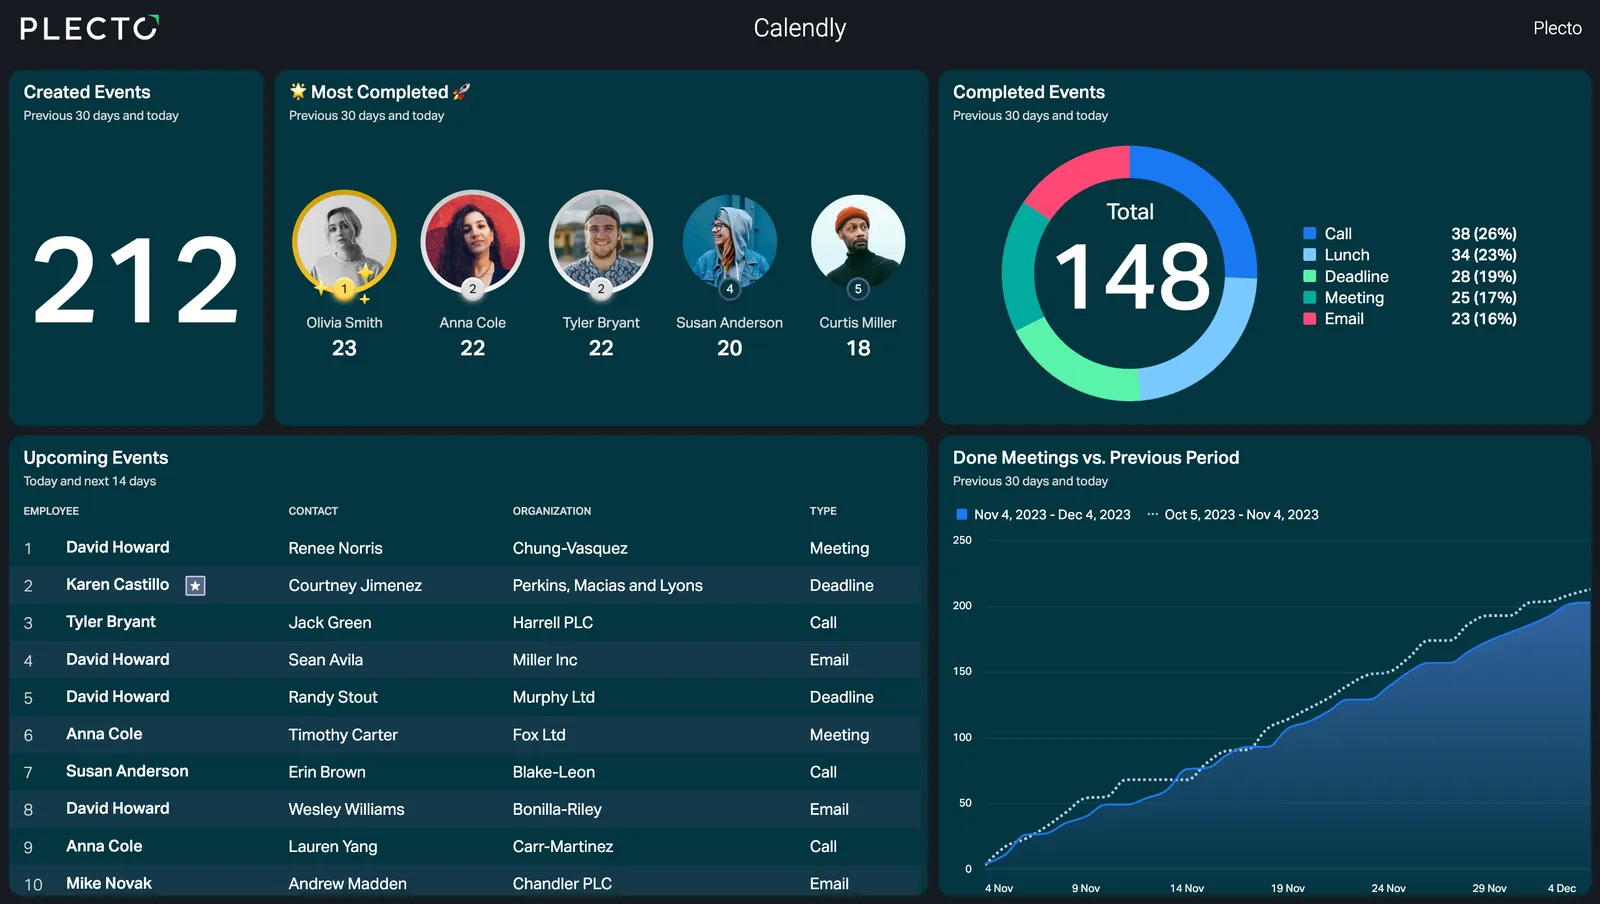
The Calendly dashboard at the top of this page is a Plecto demo dashboard with sample data and fictional people. A large tile shows 212 events created in the previous 30 days. Next to it, a podium ranks the five people with the most completed events, from 23 down to 18, each with a photo. A donut shows 148 completed events in total, split by event type.
The ranking is what changes behavior. When reps see their own count against colleagues, booked meetings stop being a number in a report and become something the team can act on. You can add a target per person, and a contest if you want to push meetings for a week (contests are available on the Large and Enterprise plans).
Calendly dashboard KPIs next to calls and emails
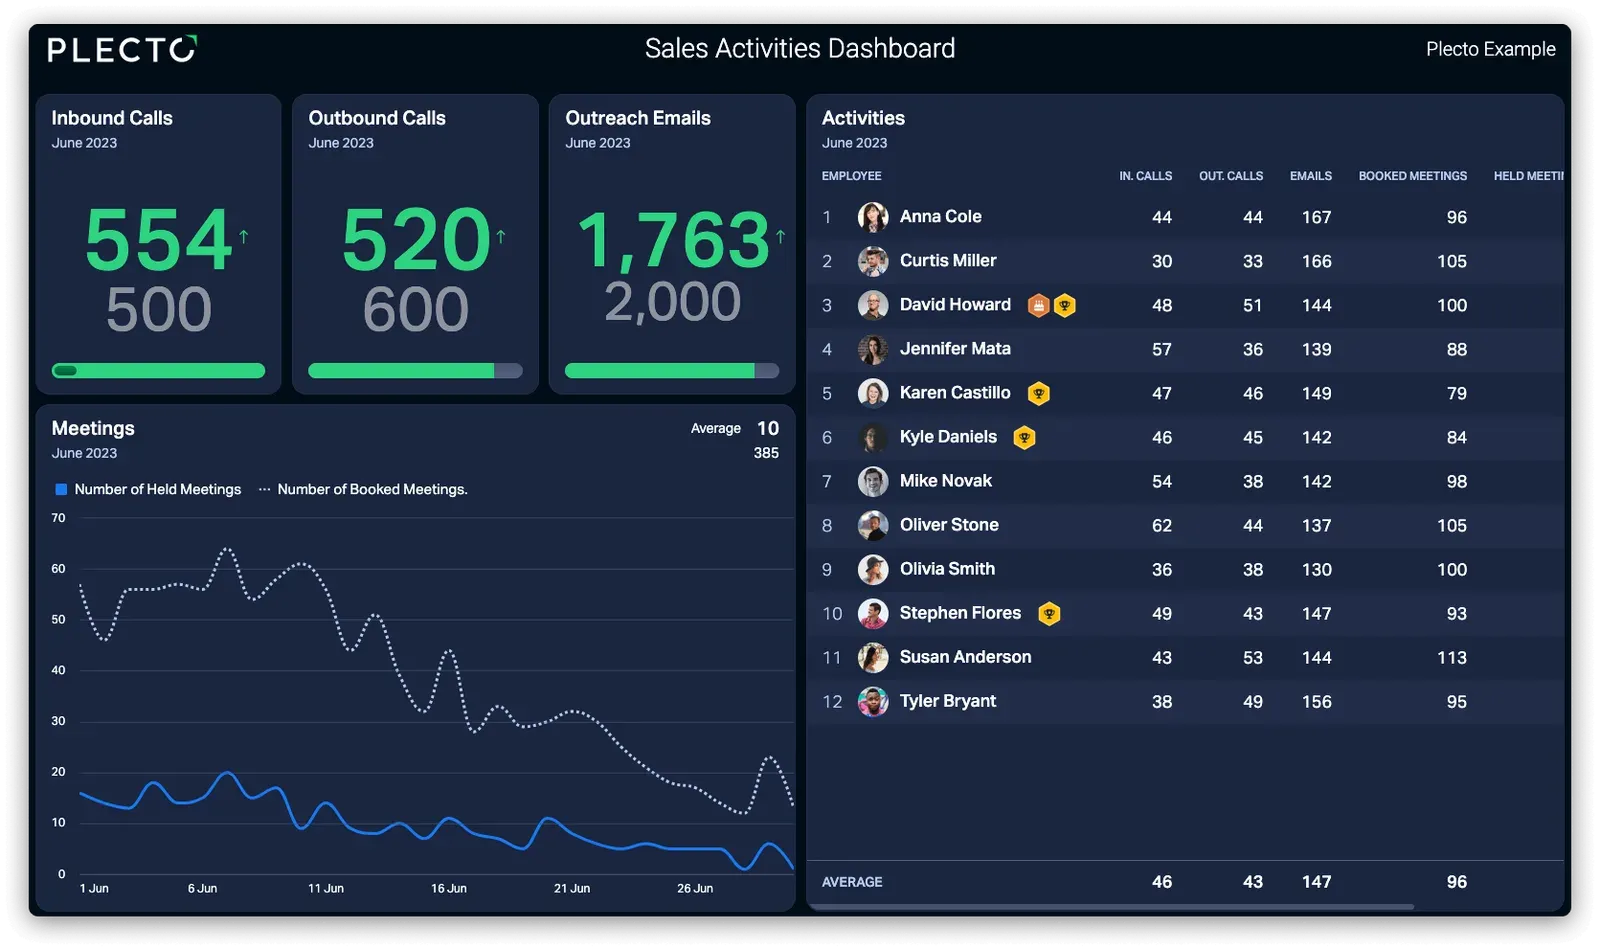
Booked meetings rarely tell the whole story alone. This second example is a Plecto sales activities dashboard built on sample data from other activity sources, not from Calendly. It shows 554 inbound calls against a target of 500, 520 outbound calls against 600 and 1,763 outreach emails against 2,000, with a table of calls, emails and booked meetings per rep and a line chart of held against booked meetings.
You can build the same layout with Calendly events per user for the meetings columns and your phone and email tools for the rest. See the sales activities dashboard for more.
Calendly reporting dashboard: upcoming meetings and trend
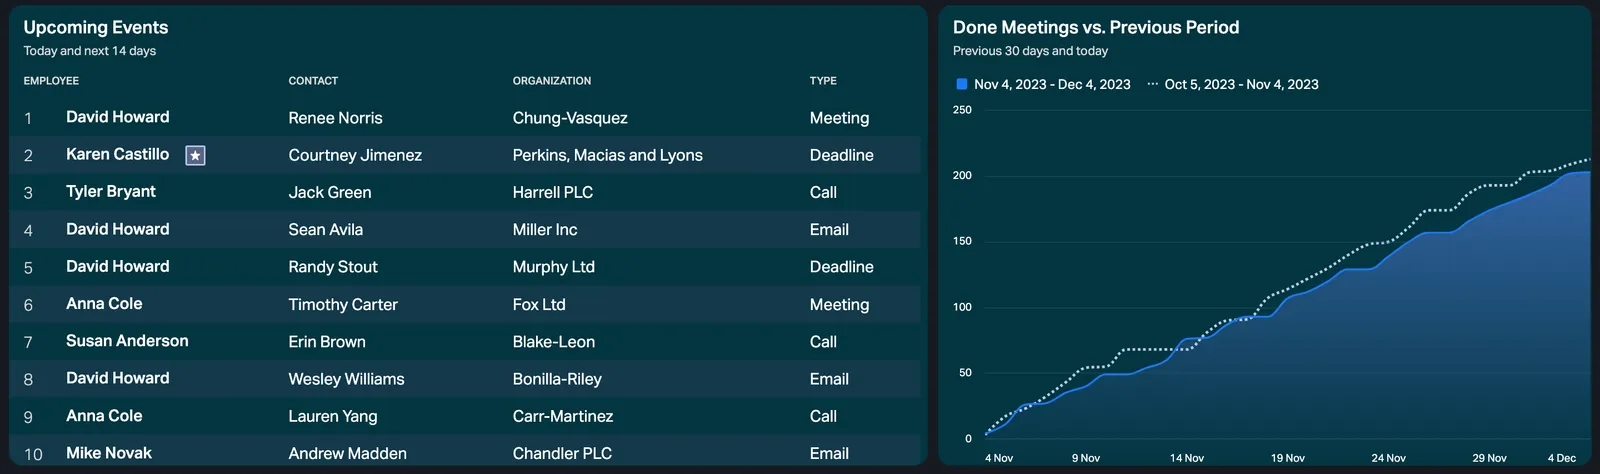
The second half of the screen looks ahead. A table lists upcoming events for today and the next 14 days, with the employee, the contact, the organization and the type. A line chart compares done meetings in the last 30 days with the 30 days before, so a manager can see at a glance whether meeting volume is rising or falling.
This is the view a sales manager checks on Monday: who has a full week, who has an empty calendar and whether the pace is ahead of last month. The related KPIs are number of booked meetings and number of meetings completed.
Which KPIs belong on a Calendly dashboard template?
Start with a handful of numbers per team and add CRM data once the basics are live.
Booked meetings per rep
Count events per user against a daily or weekly target. Plecto's Events per User data type creates one registration per internal user, so each rep finds their own line.
Meetings by event type
Split meetings by event type, such as discovery calls, demos and onboarding sessions, using the Event Types data. It shows which kind of booking your team actually spends time on.
Booking form answers
If your booking form asks questions such as how the invitee found you, the Invitee Questions and Answers data lets you chart the answers, for example meetings by lead source.
Meetings next to CRM deals
Show booked meetings beside won deals from HubSpot, Salesforce or Pipedrive to see how many meetings it takes to close a deal.
Cancellations, reschedules and no-shows depend on the fields in your data source, so check the fields offered when you set it up before you plan a KPI around them. For more ideas, see sales dashboards.
Calendly data types you can import into Plecto
According to the Calendly integration guide, you can import four data types:
| Data type | What one registration is | Update frequency |
|---|---|---|
| Events Per User | One internal user in an event. An event with four participants, two of them internal users, creates two registrations. | Every 2 minutes |
| Event Invitees | One invitee of an event. | Every 2 minutes |
| Event Types | One event type. | Every 4 hours |
| Invitee Questions and Answers | An answer to a booking form question. | Every hour |
Relations are supported for Events Per User. Custom fields and webhooks are not, so Calendly data refreshes on the schedule above rather than instantly.
Put your Calendly dashboard on a TV
A live number only helps if people see it. Add the dashboard to a Plecto slideshow and play it on an office TV through the Plecto TV app or the TV's browser. The TV dashboards guide walks through the setup.

For leadership, Plecto reports can be exported to Excel or PowerPoint, or scheduled by email every hour, day, week or month (reports are available on the Large and Enterprise plans).
How to set up a Calendly dashboard in Plecto
- Connect Calendly. In Plecto, go to Data sources > New data source > Calendly, then click Next and log in to your Calendly account.
- Choose your data. Select the data you want to import, such as Events Per User and Event Types.
- Configure the data source. Change the title, choose the default date and select which fields to import.
- Set the history. Click Next to choose how much data to import and how long to keep it, then click Import.
- Build KPIs and a dashboard. Create formulas, add widgets, set targets and put the dashboard on a TV.
The full steps are in the Calendly integration guide. Plecto has a 14-day free trial with no credit card required.
Calendly dashboard FAQ
Yes. Calendly has an Analytics dashboard with created, completed, rescheduled and canceled events, popular events and popular times, with filters and CSV export. Which plans include it varies, so check Calendly's site. Plecto adds a live Calendly dashboard for TVs, with targets.
The demo dashboards above are a starting point: created and completed events, a ranking per person, upcoming events and a comparison with the previous period. You build the widgets on your own Calendly data in Plecto, using the data types listed on this page.
Connect Calendly as a data source in Plecto, choose the data types to import, then create formulas such as events per user and add them as widgets. Schedule a report by email or play the dashboard on a TV. The steps are above.
Plecto imports Events Per User, Event Invitees, Event Types and Invitee Questions and Answers. Events Per User and Event Invitees update every 2 minutes, Event Types every 4 hours and Invitee Questions and Answers every hour.
Yes. Plecto has 150+ integrations, so you can show booked meetings next to deals from HubSpot, Salesforce or Pipedrive on the same dashboard.
Yes. Add the dashboard to a Plecto slideshow and play it on office TVs through the Plecto TV app or the TV's browser. See the TV dashboards guide for the steps.