 Sign in

Data Flow Node Editor
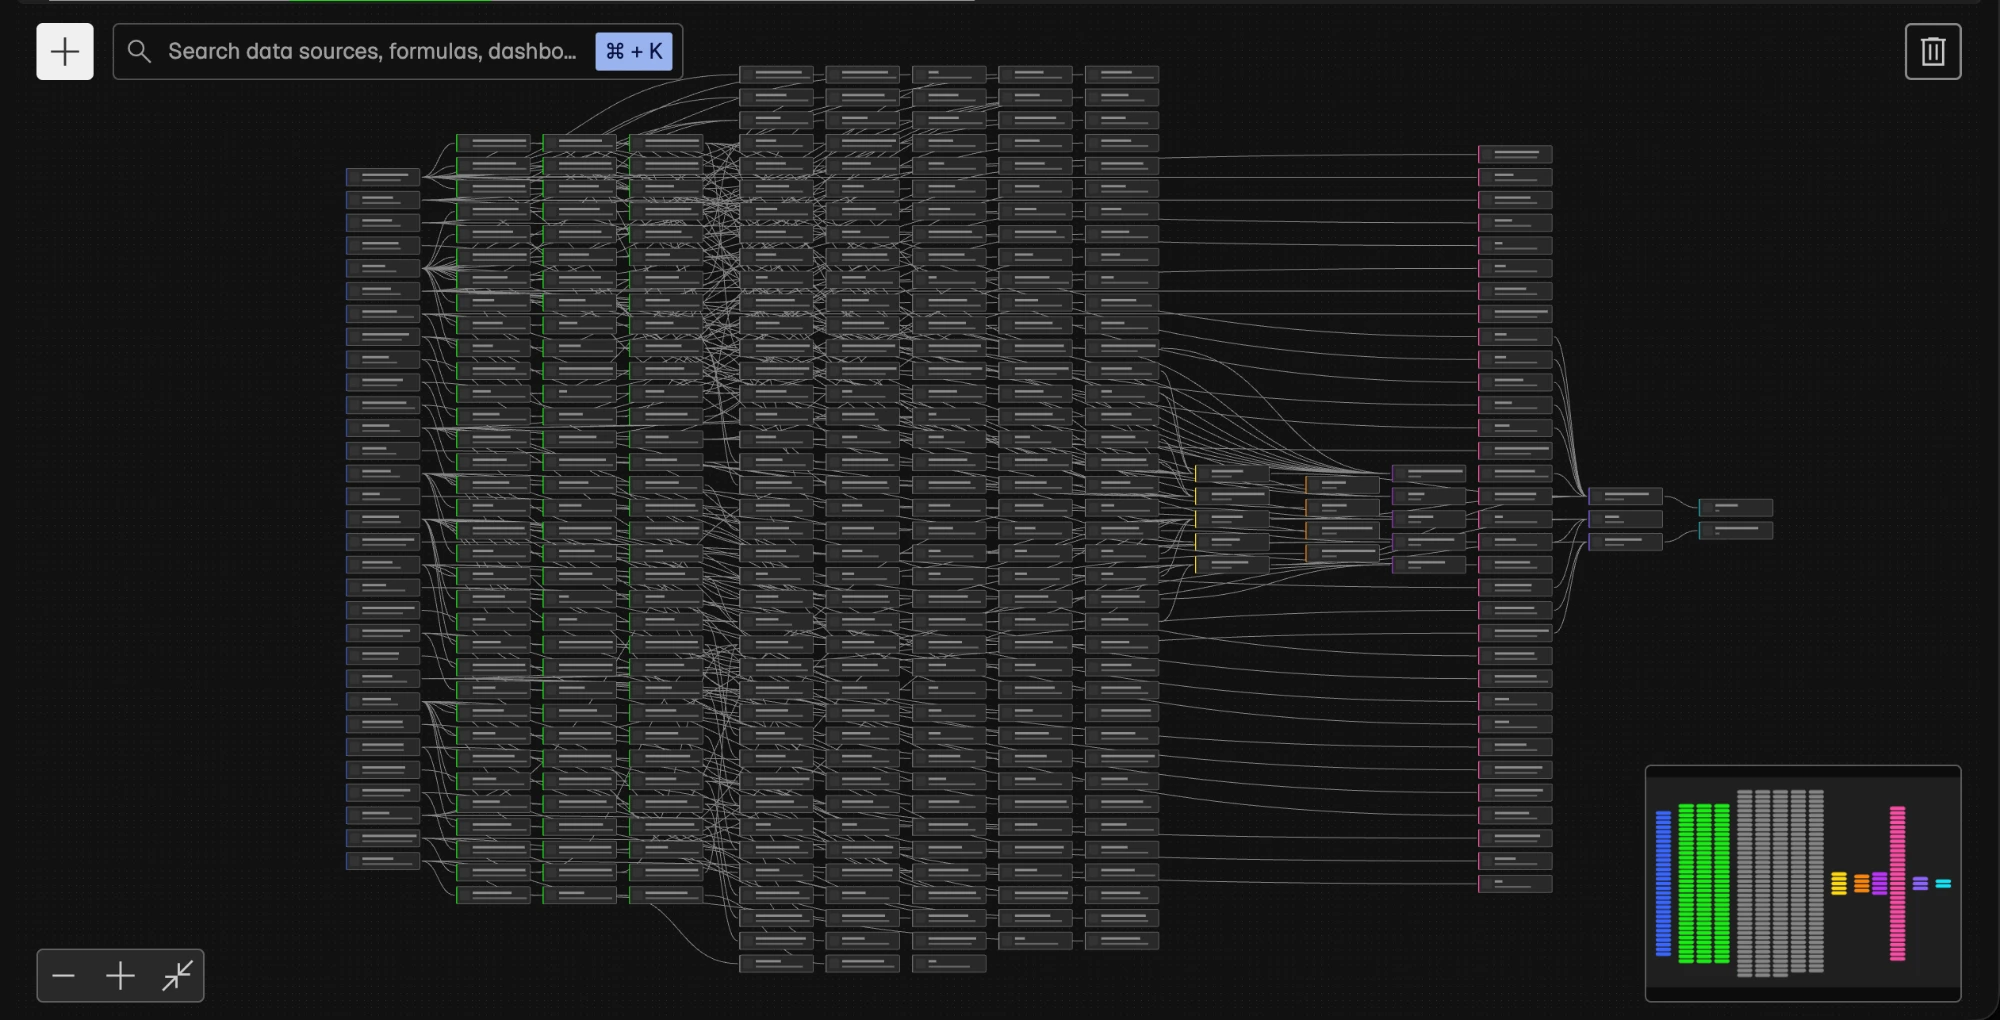
Data flow is the Plecto node editor. It draws your whole setup as one map: data sources on the left, then the formulas, widgets, dashboards, contests, reports, notifications, slideshows and TVs that use them. On the same canvas, you can see what depends on what, edit items, build new ones and clean up what nobody uses.
This guide shows you how to open Data flow, read the canvas, find items, edit and create from a node, and delete items safely.
What you can do with Data flow
- See the impact of a change. Click a data source to see every formula, widget, dashboard and TV that depends on it before you change anything.
- Find what's broken or forgotten. List formulas that don't parse, disabled data sources, ended contests and dashboards nobody has opened for two weeks.
- Build in place. Drag from a card to create a formula, widget, contest, slideshow or TV that's already connected to it.
- Clean up safely. Delete one item, or everything downstream of it. Plecto checks what still uses those items before anything is deleted.
Note: Admins with All permissions and team managers can open Data flow. Team managers only see items linked to their own teams and sub-teams. Learn more about permissions.
How to open Data flow
- Go to Data Sources.
- Click the Data flow tab at the top of the page, between Data Sources and My registrations.
If you don't see Data flow, your role doesn't include access. Ask an admin in your organization.

Read the Data flow canvas
Each card on the canvas is a node, one item in your Plecto account. Each line between two cards is a link: data flows from the card on the left into the card on the right. A data source feeds a formula, a formula feeds a widget, a widget sits on a dashboard, a dashboard plays in a slideshow, and a slideshow plays on a TV.
Node types in Data flow
Each type has its own colour and icon. The card's subtitle shows the type plus a detail, such as the integration behind a data source or the calculation of a formula.
| Node | What it is | Feeds into |
|---|---|---|
| Data source | Imported or manual data | Formulas, widgets, report widgets, notifications |
| Formula | A KPI calculation | Other formulas, widgets, contests, report widgets, notifications |
| Widget | A dashboard widget or a report widget | The dashboard or report it's on |
| Dashboard | A dashboard and its widgets | Slideshows |
| Contest | A contest based on a formula | Slideshows |
| Report | A report and its widgets | Nothing, it's the end of the flow |
| Notification | A notification and its trigger | Slideshows it displays on |
| Slideshow | A rotation of dashboards and contests | TVs |
| TV | A paired TV screen | Nothing, it's the end of the flow |
When a type is hidden, Data flow draws the link straight past it. For example, with widgets hidden, a formula links directly to the dashboard that shows it.
Card states in Data flow
- Red card with a warning icon: a formula that doesn't parse (Formula does not parse). Widgets that use it won't show correct values until you fix it.
- Dashed border: a widget you're creating that isn't saved yet (Not on a dashboard or Not in a report).
- Status icon on a data source: its import status, such as Temporary error, Permanently disabled or Disabled by admin.
- Status icon on a contest: whether it's live, scheduled or ended.
- Warning icon on a dashboard: nobody has opened it for 14 days or more.
- Disabled in the subtitle: a notification that's switched off.
Find items in Data flow
Large accounts can have thousands of nodes. Use the controls in the page header to narrow down the canvas.
Show active, inactive or unused items
| Segment | Shows |
|---|---|
| Active (default) | Everything that's neither inactive nor unused |
| Inactive | Formulas that don't parse, data sources whose import is switched off, contests that have ended or have no start date, and dashboards nobody has opened for 14 days or more |
| Unused | Items nothing reads from. A data source or formula is unused when nothing uses it. Any other item is unused when it has no links at all. |
| All | Every node in your account |
Each segment shows how many items it contains. An item can be both inactive and unused.

Tip: Unused and Inactive are good starting points for a clean-up. A dashboard with widgets on it always counts as used, so look for stale dashboards under Inactive.
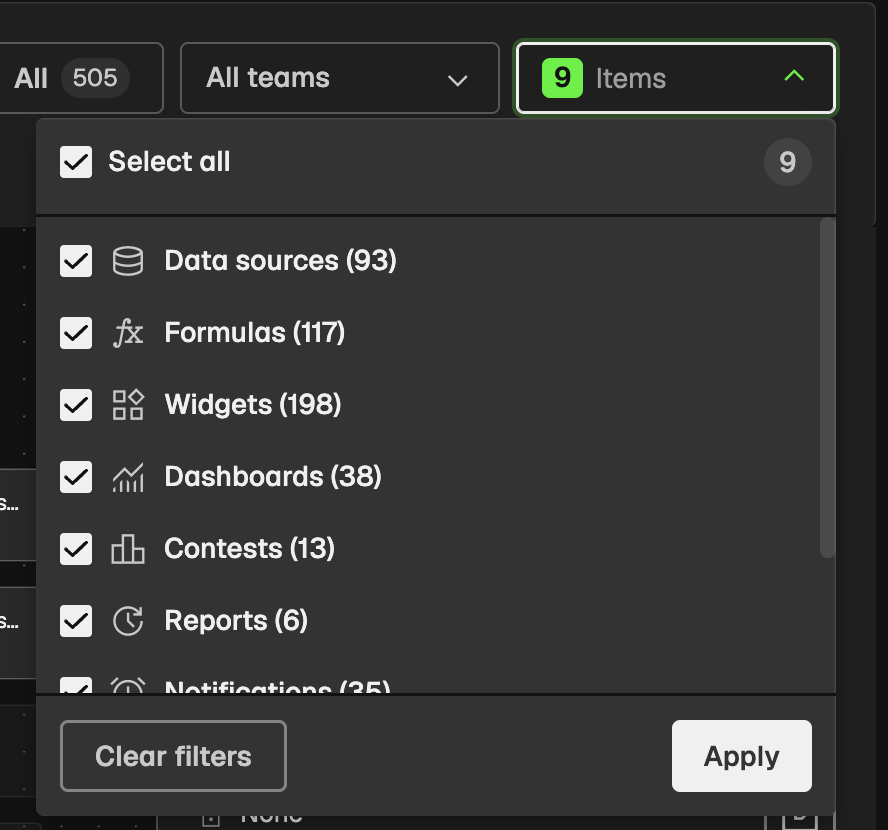
Choose which items Data flow shows
By default, Data flow hides Formulas, Widgets and Notifications to keep the map readable. Data sources then link straight to the dashboards that use them.
To show more types:
- Open the Items dropdown.
- Select the types you want, or click Select all.
- Click Apply.
At least one type must stay selected. Clear filters shows every type again. Data flow remembers your choice in this browser.
Filter Data flow by team
If your account has more than one team, pick a team in the All teams dropdown. Data flow shows the items linked to that team and its sub-teams, together with the full path above and below them.
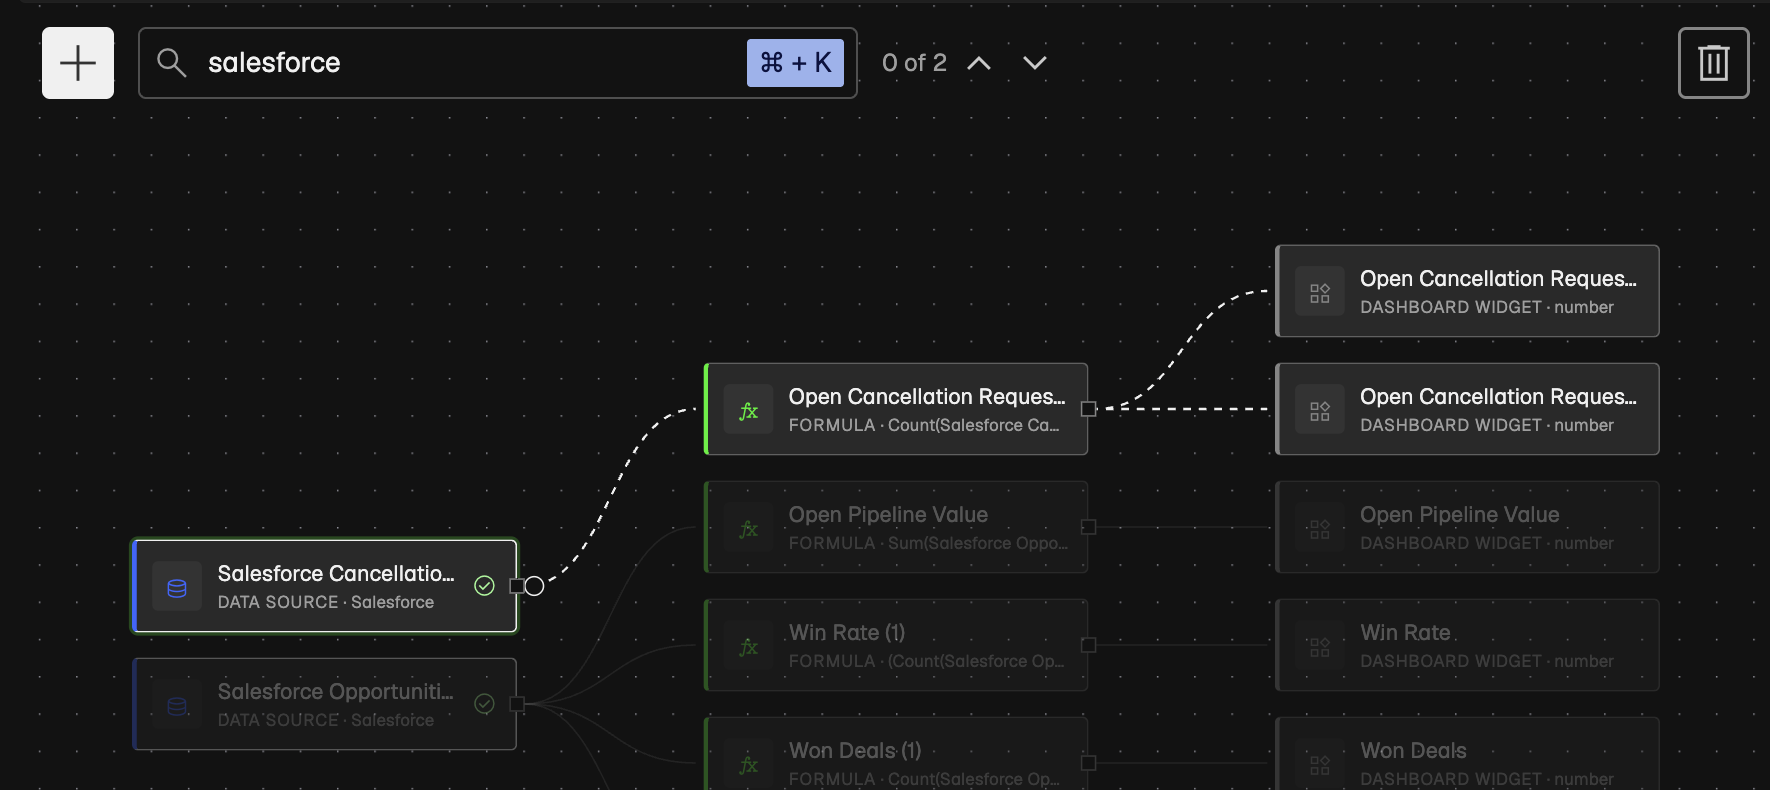
Search Data flow
- Press ⌘ + K (Mac) or Ctrl + K (Windows), or click the search field.
- Type at least two characters of an item's name.
- Press Enter to jump to the next match, or Shift + Enter for the previous one. The counter shows your position, for example 1 of 3.
Search matches item names and keeps each match's full path on the canvas. It also finds items of hidden types, but only within the selected segment, team and focus. Press Esc to clear the search.
Move around the Data flow canvas
- Pan: drag the background.
- Zoom: scroll or pinch, or use Zoom in, Zoom out and Fit to screen in the bottom-left corner.
- Map: click or drag the minimap in the bottom-right corner to jump to another part of the canvas. It hides while a side panel is open.
Cards are placed automatically and can't be dragged. In large accounts, cards load in batches. A spinner (Loading more…) shows until everything has loaded, and the layout may settle once more at the end.
Inspect a node in Data flow
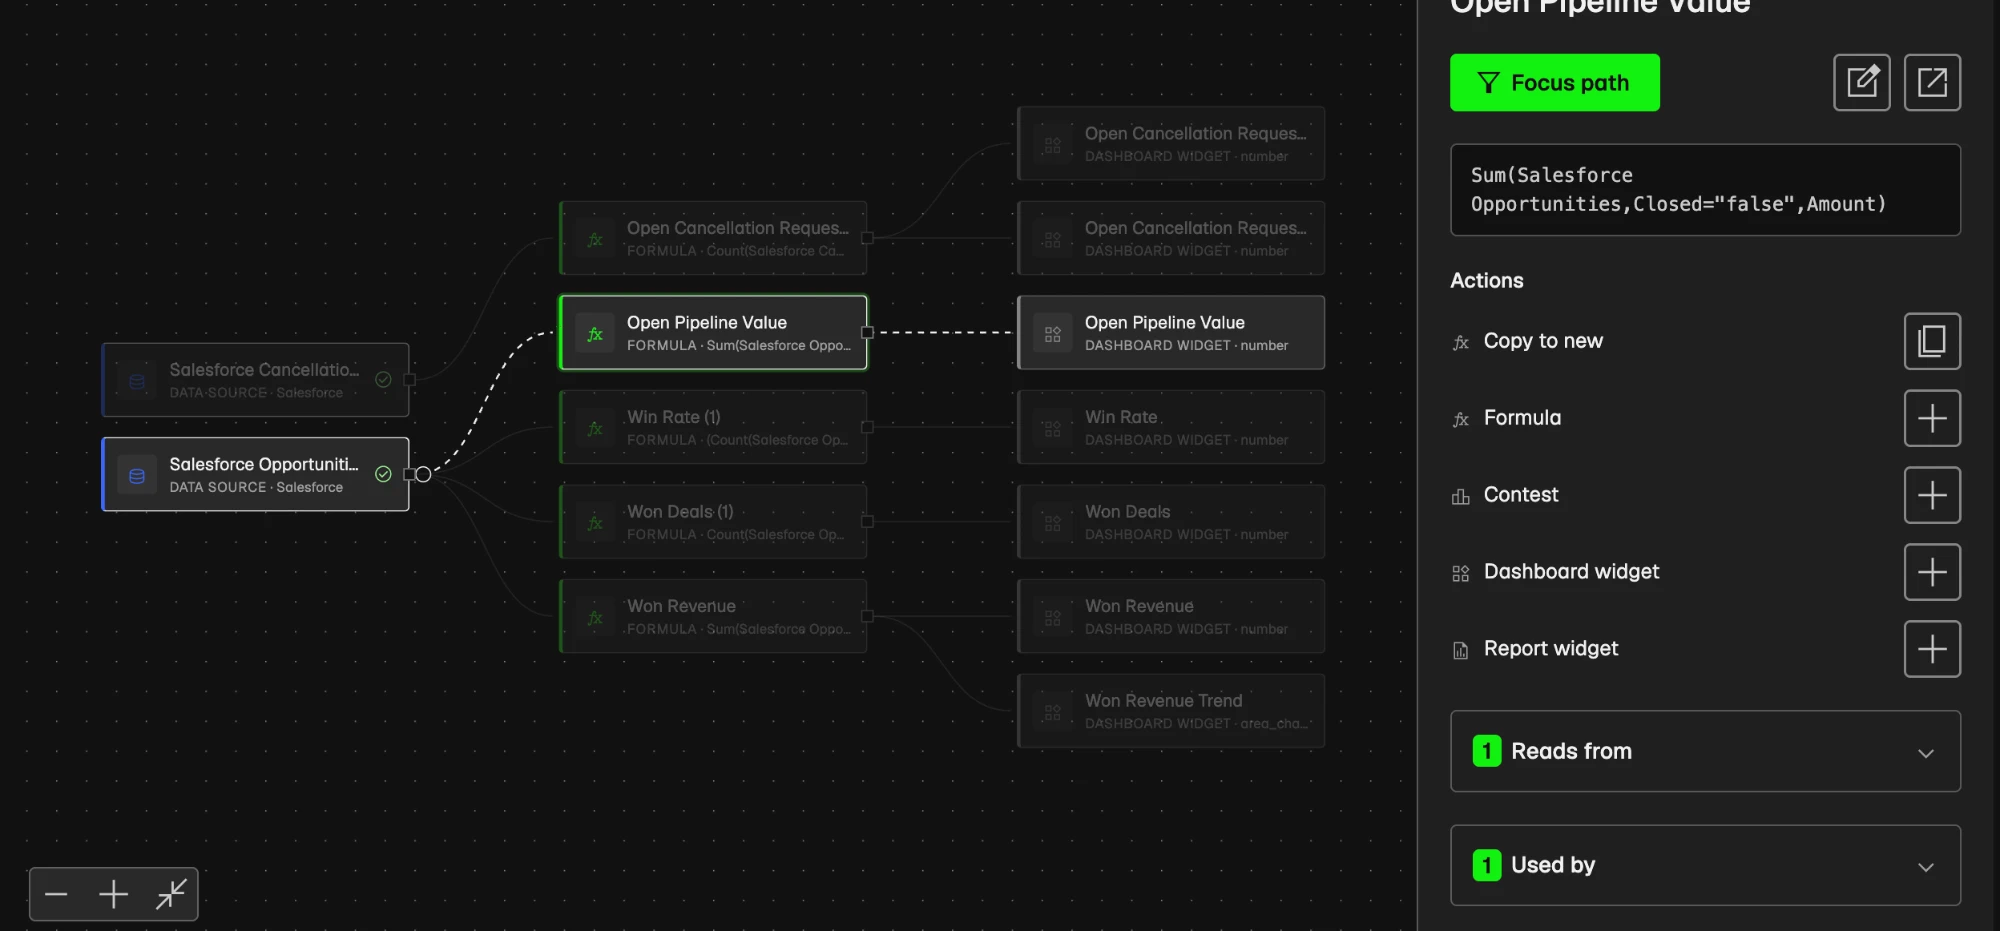
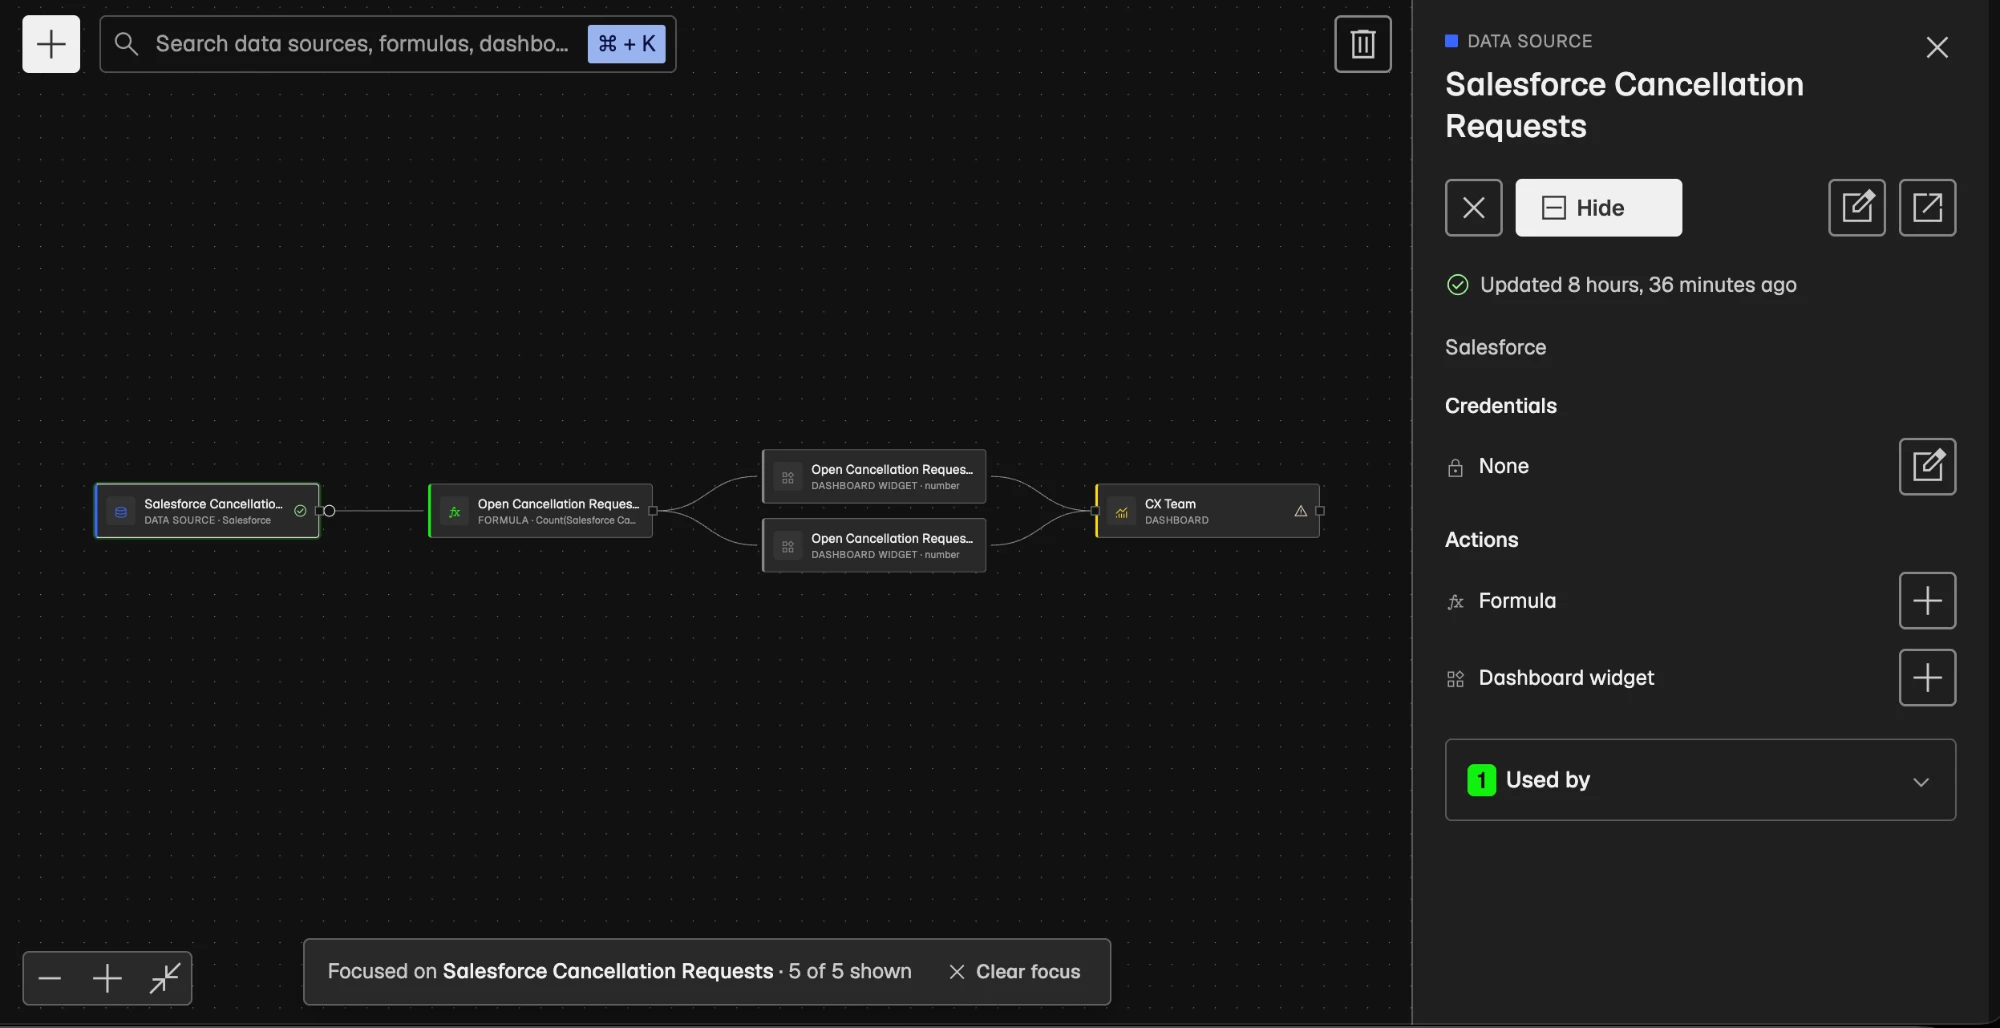
Click a card to select it. Data flow highlights its whole path, everything that feeds it and everything it feeds, and dims the rest. The Inspector opens on the right and shows:
- Status: the import status of a data source, the state of a contest, or when a dashboard or TV was last accessed.
- Calculation: for a formula.
- Credentials: for integration data sources. See Change credentials from Data flow.
- Actions: what you can create or connect from this item. See Create and link items in Data flow.
- Reads from and Used by: the items connected to this one. Click an item in the list to jump to it.
The buttons at the top of the Inspector:
| Button | What it does |
|---|---|
| Edit | Opens the item's settings in the panel |
| Preview | Shows a live preview of a dashboard, contest or widget, or plays a slideshow in a new tab |
| Open | Opens the item's own page in a new tab |
| Focus path | Hides everything that isn't on this item's path |
Focus on one path
Double-click a card, or click Focus path in the Inspector. A bar at the top of the canvas shows Focused on and the item's name, with how many items are shown. If your filters hide part of the path, click Expand in the Inspector to bring it back.
Click Clear focus or press Esc to return to the full map.
Edit items from Data flow
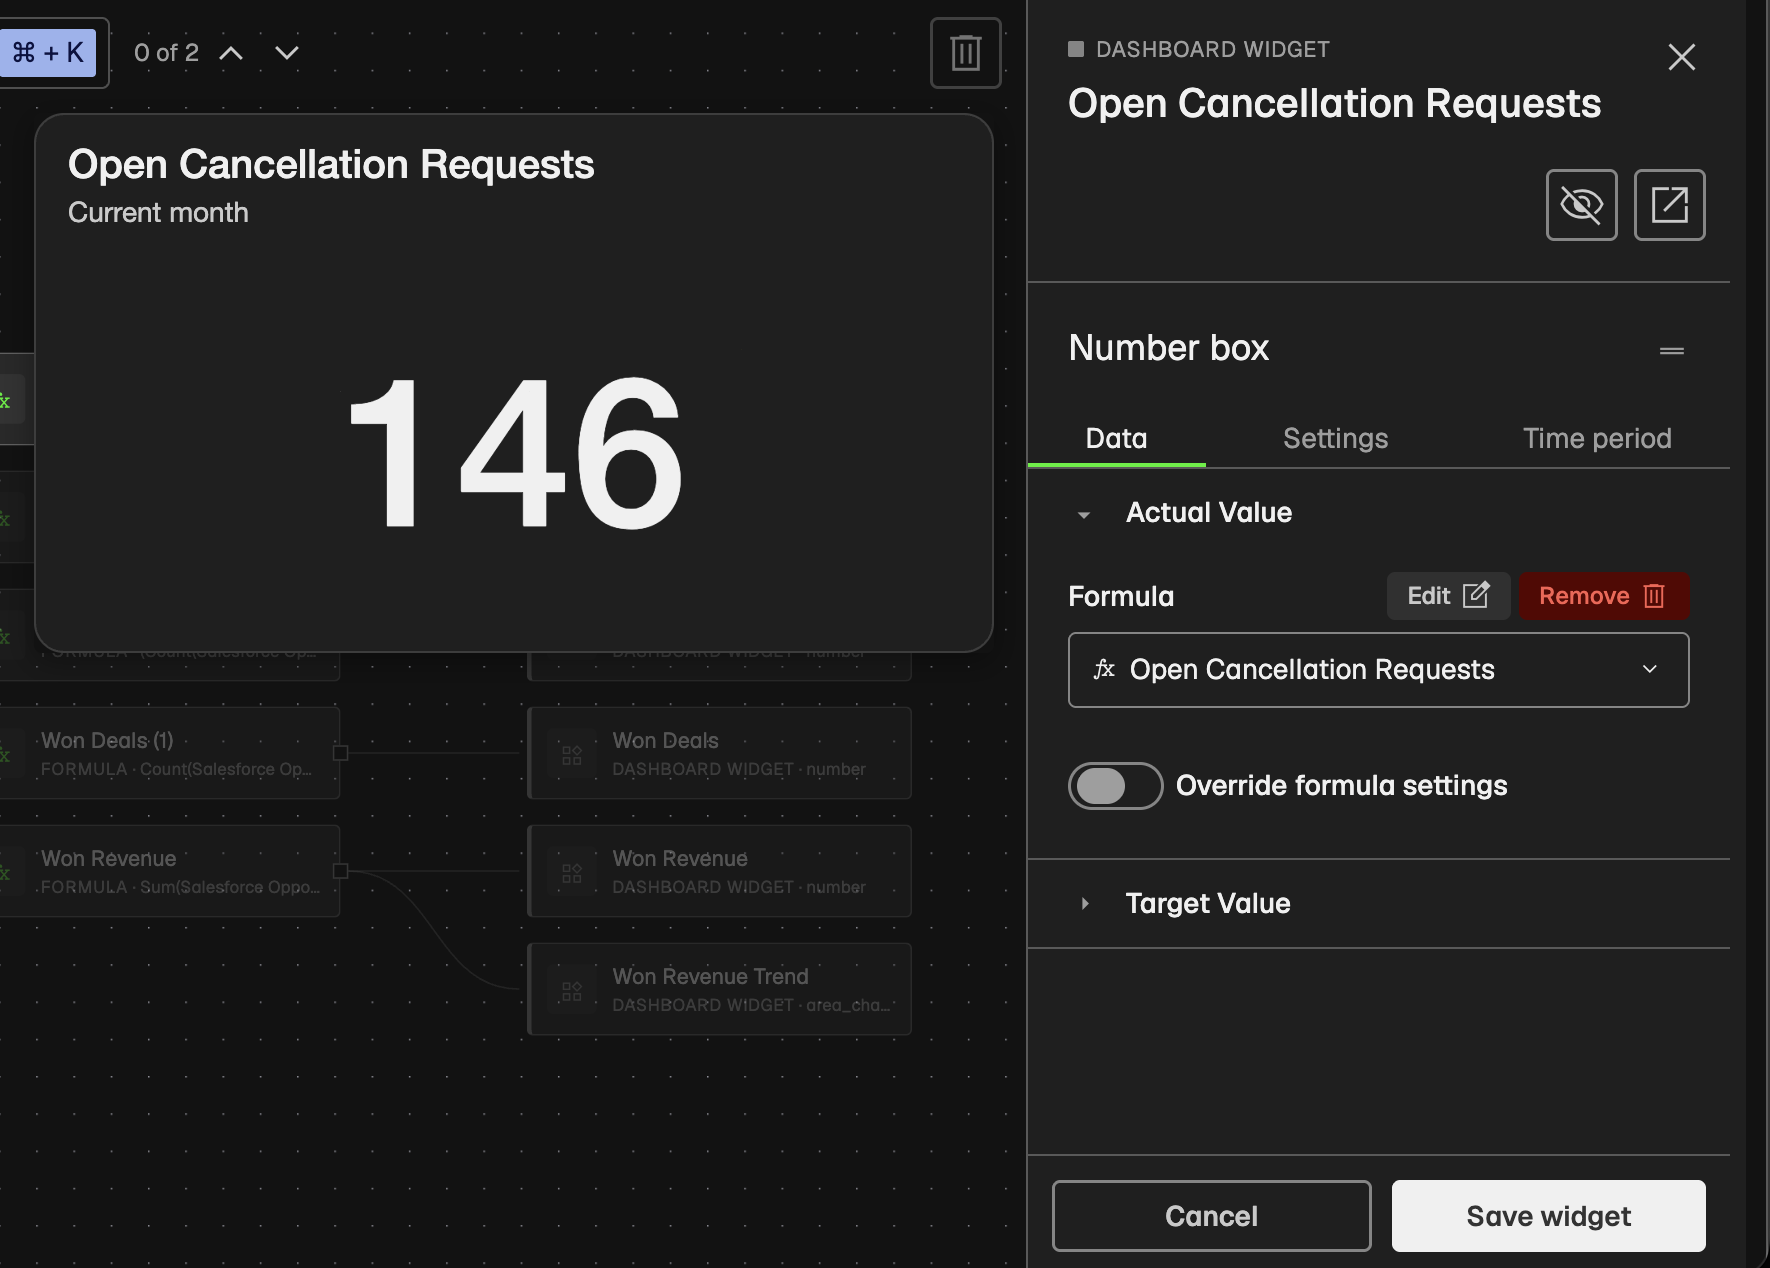
Click Edit in the Inspector to change an item without leaving the canvas. The Edit button only shows for items you're allowed to edit.
| Item | What you can edit |
|---|---|
| Formula | The calculation, in the formula editor. Some advanced formulas, such as ones with IF statements or long calculations, can only be renamed here. Click Open to edit their calculation. |
| Dashboard widget | The widget's settings, with a live preview next to the panel |
| Report widget | The widget's settings, with a live preview |
| Dashboard | The same settings as the dashboard's Settings tab, such as title, parent dashboard, access, time zone and layout |
| Report | Title, access, data filter and employee names |
| Data source | The settings of manual data sources and integration imports |
| Contest | Name, time frame, type, theme, formula and participants. Set milestones and prizes on the contest's own page. Ended contests can't be edited. |
| Notification | Its conditions |
| Slideshow | Name, slides, rotation and TVs |
| TV | Name and slideshow |
Click Save to apply your changes, or Cancel to discard them. Clicking the canvas doesn't close an open form, so you won't lose unsaved work by accident.
Learn more about the Visual Formula Editor.
Change credentials from Data flow
You can point an integration data source at other credentials of the same integration, for example when the colleague who connected it leaves.
- Click the data source card.
- In the Credentials section of the Inspector, click Change credentials (the pencil icon).
- Pick the new credentials in the Credentials dropdown.
- Click Save.
Warning: Use credentials of the same account. Data that's already imported stays. Credentials of a different account import that account's records into the same data source, and a record with the same ID as an existing one overwrites it.
If the data source was disabled, it stays disabled after the change. Enable it again on the data source's own page. Some data sources, such as webhook-based and streaming integrations, don't support changing credentials. To update the login of existing credentials instead, see How to refresh your credentials.
Create and link items in Data flow
Create items with the + menu
Click + in the header and choose Formula, Dashboard, Widget, Contest, Report, Slideshow or TV. Most items open in the side panel. Report opens the report builder in a new tab. You only see the types you're allowed to create.
Build from a node in Data flow
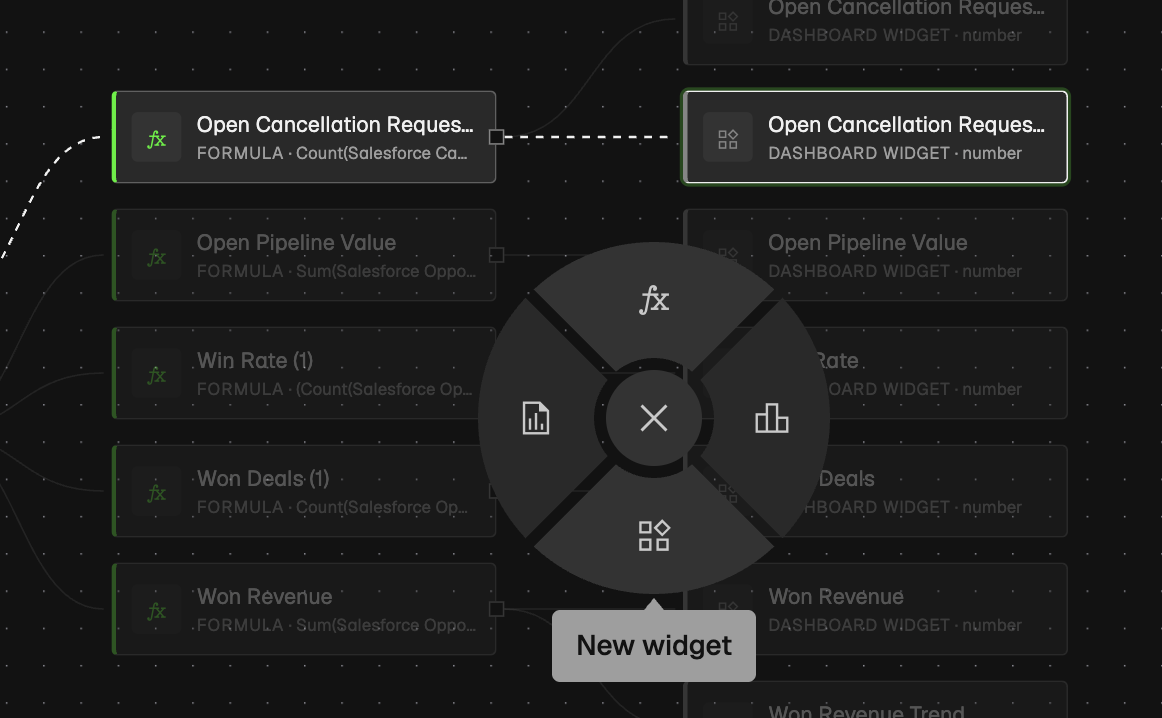
- Drag from the handle on the right side of a card to build on it, or from the handle on the left side to create something that feeds it.
- Release on an empty part of the canvas. A circular menu opens (Create from here).
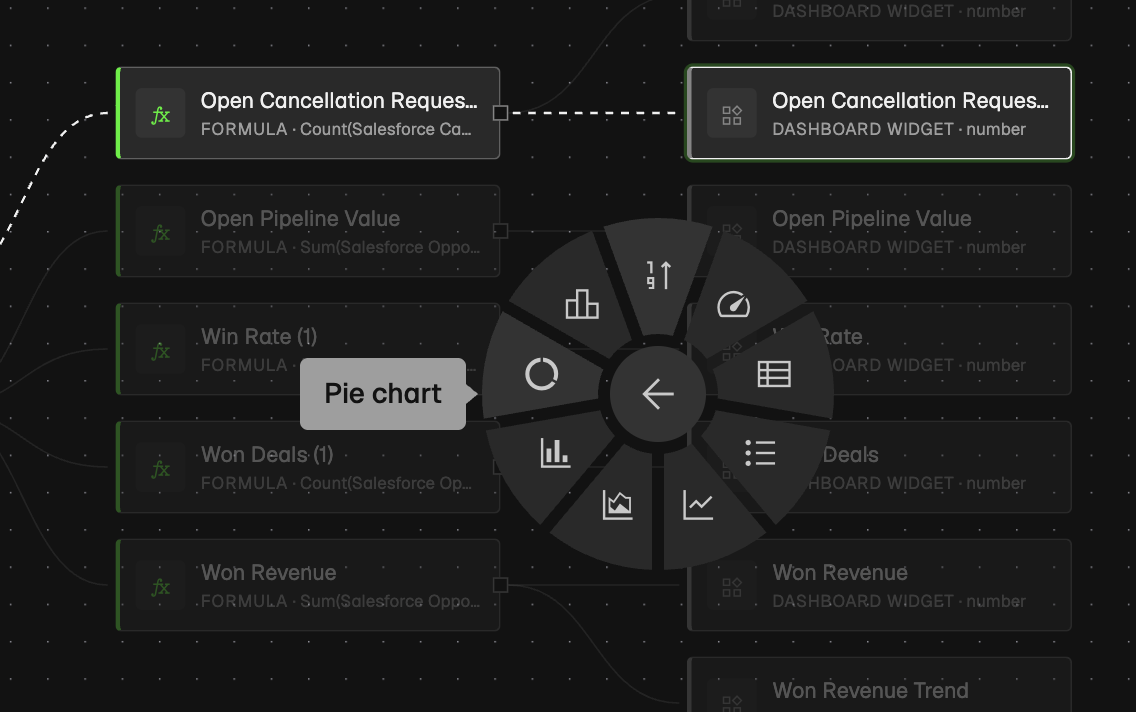
- Pick what to create. For a widget, a second ring asks for the widget type.
| Starting from | Right handle (build on it) | Left handle (feed it) |
|---|---|---|
| Data source | New formula, New widget (funnel chart) | – |
| Formula | New formula, New contest, New widget, New report widget | – |
| Dashboard | New slideshow, Add to slideshow | New widget |
| Contest | New slideshow, Add to slideshow | – |
| Report | – | New report widget |
| Slideshow | New TV, Connect TV | New dashboard, Add dashboard, New contest, Add contest |
| TV | – | New slideshow, Connect slideshow |
The same options are listed under Actions in the Inspector, each with a + button, so you can also create from there.
Add a new widget
- Drag from a formula's right handle and pick New widget, or click + next to Dashboard widget under Actions.
- Choose a widget type, for example Number box, Speedometer or Leaderboard. A dashed draft card appears on the canvas.
- In Dashboard, pick the dashboard the widget goes on, or click Create a new dashboard.
- Set up the widget in the form that appears.
- Click Save.
Nothing is saved until you click Save. Cancel removes the draft card. Report widgets work the same way, with a report instead of a dashboard. Learn more about widgets in reports.
Link existing items
Drag from one card's right handle onto another card's left handle:
- Formula or data source to a dashboard: starts a new widget that reads from the formula or data source and sits on the dashboard. You can also link a formula to a report to start a report widget.
- Dashboard or contest to a slideshow: adds it as a slide after you confirm.
- Slideshow to a TV: opens the TV's settings with the slideshow picked.
You can only link to items you're allowed to edit. A new link doesn't save anything until you confirm it.
Move or remove a link
Select a card, then drag the dot at the start of one of its links:
- Drop it on an empty part of the canvas to remove the link, for example to take a dashboard off a slideshow or disconnect a TV.
- Drop it on another card of the same kind to move the link, for example to show a dashboard on a different slideshow, or to make a formula read from a different data source.
Plecto asks you to confirm each change. When you swap what a formula reads from, the dialog shows the new calculation before you save.
Note: A disconnected TV is unpaired. To use it again, enter the code it shows to pair it. See the TV troubleshooting guide if a TV doesn't connect.
Copy an item
Under Actions, click the copy button next to Copy to new to duplicate a dashboard, report, notification or formula. A formula copy gets (copy) after its name. For a contest, a pre-filled create form opens in a new tab.
Delete items in Data flow
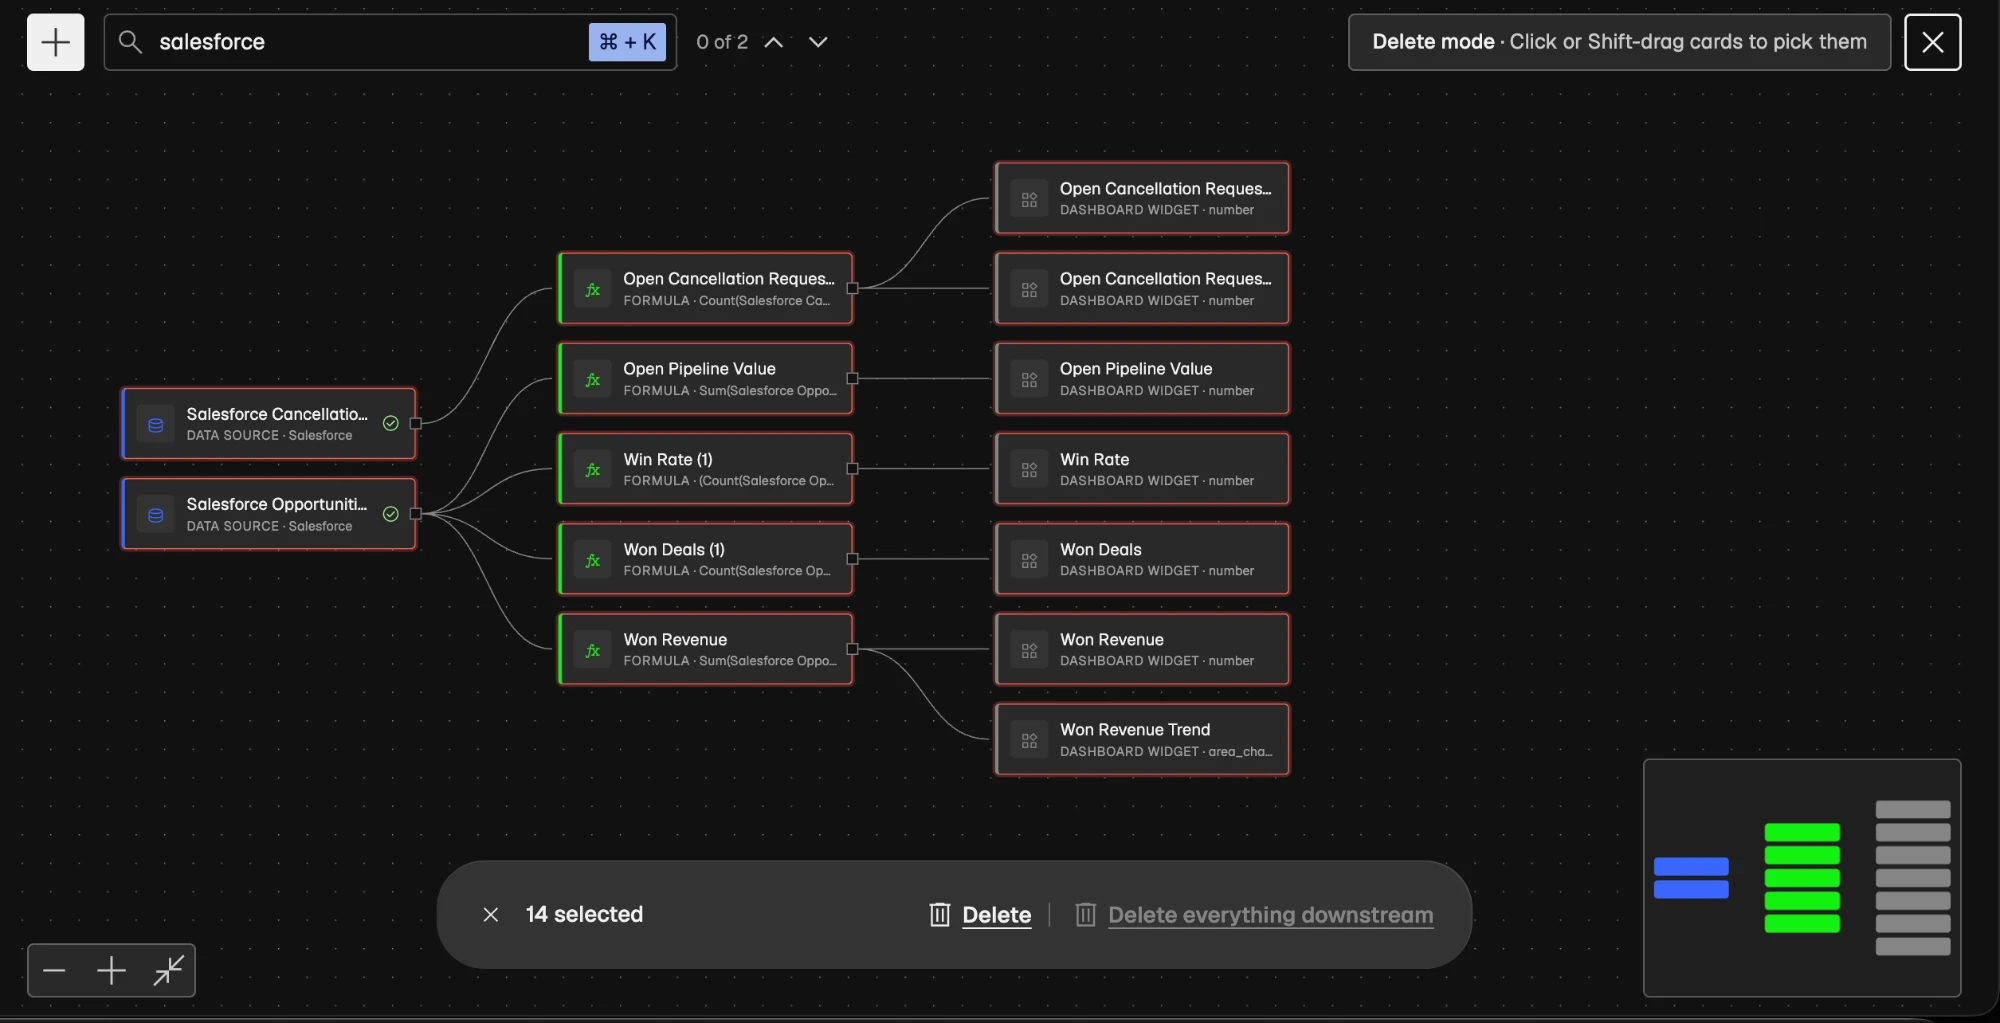
- Click the trash icon (Delete mode) at the right end of the header.
- Click the cards you want to delete, or hold Shift and drag a box around them. Picked cards get a red outline.
- In the bar at the bottom, click Delete. To also remove what depends only on one card, pick that single card and click Delete everything downstream.
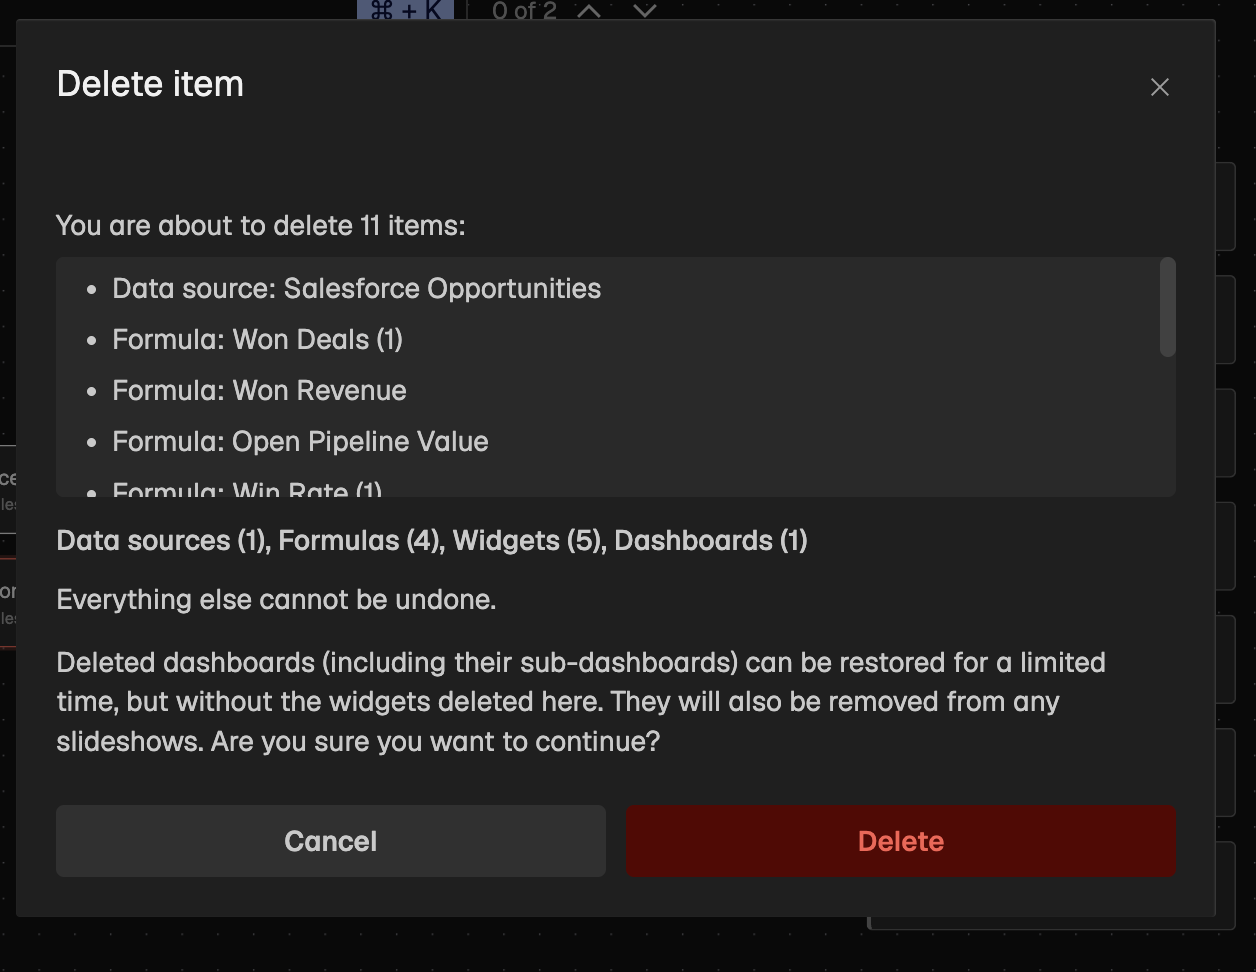
- Review the confirmation dialog and click Delete.
The confirmation dialog lists:
- The items you picked.
- Related items that will also be deleted, such as the widgets on a dashboard.
- Items that are kept because other items use them too.
Plecto blocks the delete (Action blocked) if something outside your selection still uses an item, for example a formula that another dashboard still reads. Slideshows and TVs are never removed by Delete everything downstream.
Warning: Deleted dashboards, including their sub-dashboards, can be restored for a limited time. Everything else is deleted permanently and can't be undone.
You can only pick items you're allowed to delete, and deleting is available once the whole map has loaded. Press Esc or click X to leave delete mode.
Keyboard shortcuts in Data flow
| Shortcut | What it does |
|---|---|
| ⌘ + K / Ctrl + K | Search |
| Enter / Shift + Enter | Jump to the next / previous search match |
| Double-click a card | Focus its path |
| Shift + drag (in delete mode) | Pick cards with a box |
| Esc | Clear the search, close the panel or menu, leave delete mode, or clear the focus |
FAQ
Why can't I see Data flow in my account?
Only admins with All permissions and team managers can open Data flow. Ask an admin in your organization for access.
Why don't I see my formulas and widgets in Data flow?
Data flow hides formulas, widgets and notifications by default. Open Items, select them and click Apply.
Can I rearrange the cards?
No. Data flow lays out the canvas automatically, from data sources on the left to TVs on the right. Use search, filters and Focus path to narrow it down instead.
Is it safe to delete everything in Unused?
Check first. Unused means no other item reads from it, not that nobody looks at it. Open or preview an item before you delete it. Plecto also blocks any delete that would break an item that's still in use.
Does drawing a link save anything?
Not on its own. Every new link opens a form or a confirmation, and nothing changes until you click Save, Add, Move or Remove.
Which languages is Data flow available in?
English, Danish and German. In other languages, Data flow shows in English.
Next steps
Data flow gives you one map of how your data becomes KPIs on dashboards and TVs. Start with Unused and Inactive to tidy up your account, then build new formulas and widgets straight from your data sources.