 Sign in

KPI Tracker: Build One Your Team Will Actually Use
A KPI tracker shows every KPI, its owner, target and status in one place. Get a copyable KPI tracker template, examples by team and a setup guide.
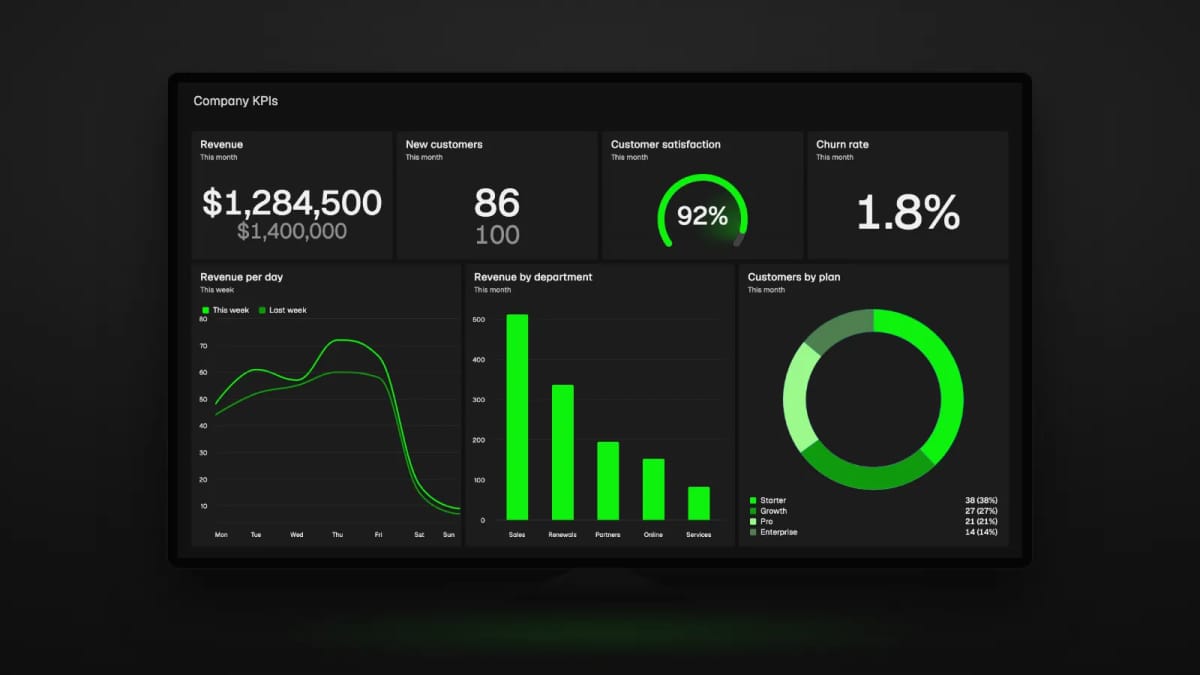
A KPI tracker is a single place where every key performance indicator your team cares about is listed with its owner, target, current value and status. Most start life as a spreadsheet. The good ones stay useful because the numbers are fresh, someone owns each row and the status column tells you what to do next, not just what happened.
This guide gives you a copyable KPI tracker template, an honest comparison of a spreadsheet against KPI tracking software, and example KPI sets for sales, support and SaaS teams. It also shows how to turn a static sheet into a live one in Plecto. If you want the practice behind the tool first, read our guide to what KPI tracking is.
What is a KPI tracker?
A KPI tracker is a table or dashboard that lists each key performance indicator next to its target, current value, trend and owner, so anyone can see in seconds whether a goal is on track. It can be a spreadsheet, a slide or live KPI tracking software that updates itself from your systems.
The tracker is the artifact. KPI tracking is the habit of reviewing it. A tracker with no review rhythm turns into a stale spreadsheet within a quarter, and a review rhythm with no tracker means everyone argues about which numbers are right.
A tracker is also narrower than a report. A report explains one period in depth. A tracker stays short, usually 5 to 12 KPIs per team, and answers one question: are we on track right now? If you are still choosing what to put in it, browse our KPI examples with formulas for the definition and calculation of each one.
What a good KPI tracker template contains
A good template has nine columns. Each one removes an argument later, so resist the urge to cut them down to just a name and a number.
| Column | What goes in it | Example |
|---|---|---|
| KPI | One clear name | Win rate |
| Owner | One named person, not a team | Sales manager |
| Formula | How it is calculated | Won deals / closed deals |
| Data source | Where the number comes from | CRM |
| Target | The number that counts as success | 25% |
| Frequency | How often it is reviewed | Weekly |
| Current | The latest value | 22% |
| Trend | Direction versus the last period | Up |
| Status | On track, at risk or off track | At risk |
You can paste that table straight into a spreadsheet and add one row per KPI. A few rules keep it honest:
- Formula and data source are not optional. Two people calculating "conversion rate" from different systems is the most common reason a tracker loses trust.
- One owner per KPI. A shared owner is no owner. The owner explains movement in the review, not just reports it.
- Status needs a rule. Decide in advance that, say, within 10% of target is at risk and worse than that is off track. Otherwise status becomes a mood.
- Keep the trend honest. Compare against the previous period of the same length, not against the best week of the year.
KPI tracker in a spreadsheet vs KPI tracking software
A spreadsheet is the right KPI tracker to start with, and often the right one to keep if you have fewer than a dozen KPIs and one person who updates them. The trade-offs show up when the number of KPIs, teams and data sources grows.
| Spreadsheet KPI tracker | KPI tracking software | |
|---|---|---|
| Setup | Minutes, no approval needed | Hours to connect data sources |
| Updates | Manual copy and paste | Pulled from your systems automatically |
| Accuracy | Depends on who last pasted | Same formula applied every time |
| Version control | Copies drift across inboxes | One live version |
| Alerts | None unless you build them | Can notify when a KPI hits a threshold |
| Visibility | Whoever opens the file | Dashboards, mobile and office TV screens |
| Best for | A small set of slow-moving KPIs | Daily or weekly KPIs shared by several teams |
The weak point of a spreadsheet is not the grid, it is the person. Somebody has to export from the CRM, paste it in and fix the formulas, and the week they are on holiday the tracker goes stale. We cover the same trade-off in more depth in our guide to Excel dashboards and when to move beyond them.
Software fixes the freshness problem but adds a cost of its own: you have to connect each data source and agree on the formulas once. That work is worth doing for KPIs people check every day, such as calls handled or deals won. It is overkill for a quarterly board metric that changes once a month. If you are weighing tools, our KPI dashboard software overview explains what to look for.
How to set up a KPI tracker in six steps
Setting up a KPI tracker takes an afternoon if you decide the KPIs and owners before you open any tool.
- Start from goals, not metrics. Write down the three outcomes the team is accountable for this quarter. Only add a KPI if it tells you whether one of those outcomes is on track.
- Pick 5 to 12 KPIs per team. More than that and nobody can say which ones matter. Mix leading KPIs (activity you can change this week) with lagging ones (results).
- Fill in the formula and data source first. If you cannot say where a number comes from, it does not go in the tracker yet.
- Set targets and status rules. Use last quarter's actuals as a baseline and agree the status thresholds with the owner before the first review.
- Assign one owner per row. The owner is the person asked "why did this move?" in the review.
- Fix a review rhythm. Daily KPIs get a daily glance, weekly KPIs a weekly review, monthly KPIs a monthly one. Put the dates in the calendar.
Then run it for a month before you change anything. Most trackers need one round of cuts: KPIs nobody looked at, or two that measure the same thing.
KPI tracker examples by team
The right set depends on who reads it. These example sets are starting points, each KPI with a formula on our KPI examples page. Swap in whatever your team is actually accountable for.
Sales KPI tracker example
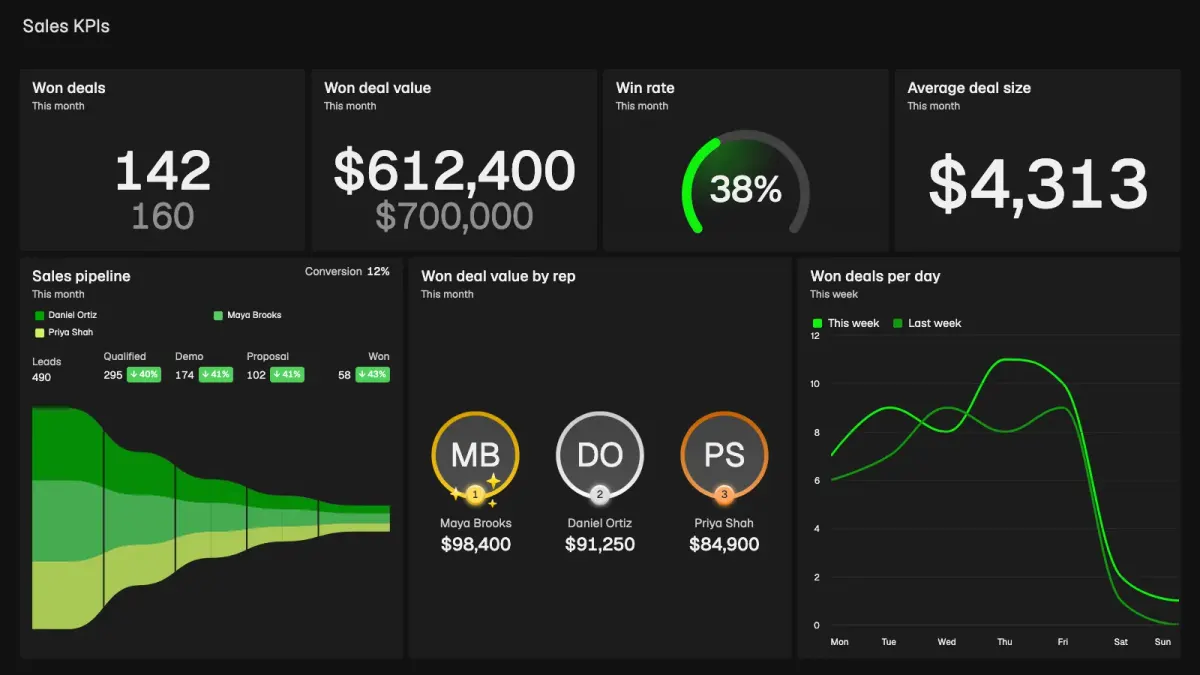
A sales KPI tracker mixes activity, pipeline and results, so a manager can see a problem early.
| KPI | Formula | Typical frequency |
|---|---|---|
| Calls made | Count of outbound calls | Daily |
| Meetings booked | Count of booked meetings | Daily |
| Win rate | Won deals / closed deals | Weekly |
| Average deal size | Revenue won / number of deals won | Weekly |
| Sales cycle length | Average days from created to won | Monthly |
| Revenue vs target | Revenue won / revenue target | Weekly |
Support KPI tracker example
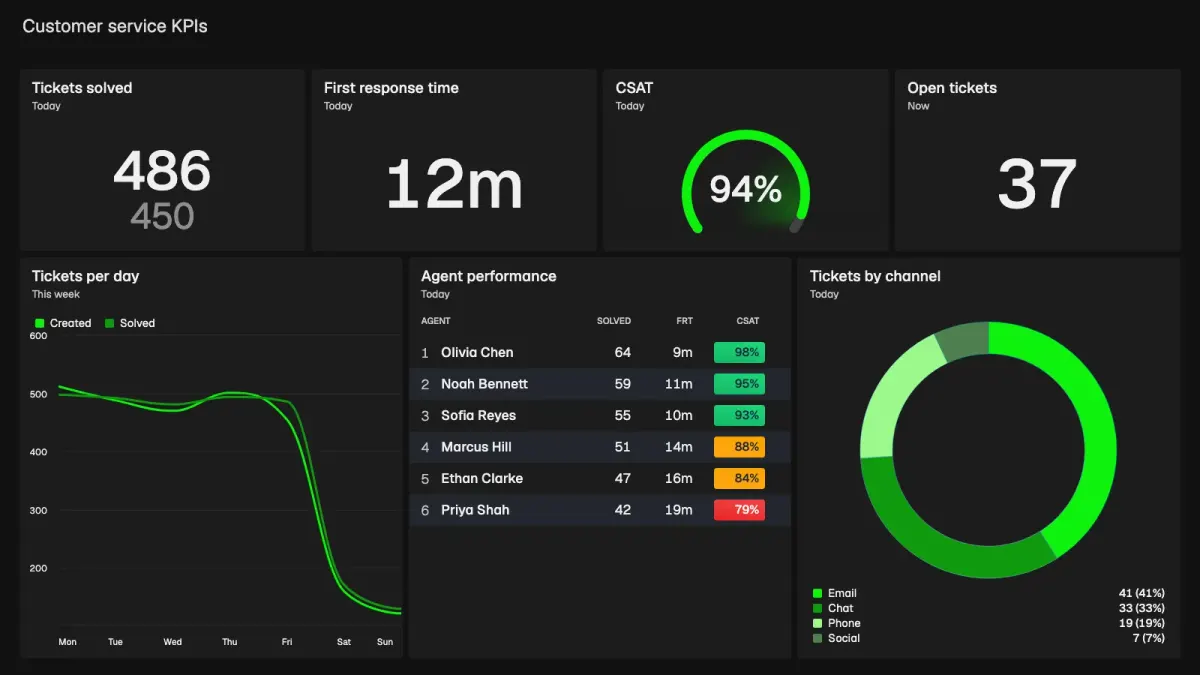
A support tracker watches speed, quality and workload. Speed KPIs react in hours, so they suit a live screen more than a weekly sheet.
| KPI | Formula | Typical frequency |
|---|---|---|
| Tickets solved | Count of tickets solved | Daily |
| First response time | Average time to first reply | Daily |
| Average resolution time | Average time from open to solved | Weekly |
| CSAT | Positive ratings / total ratings | Weekly |
| Escalation rate | Escalated tickets / total tickets | Weekly |
SaaS KPI tracker example
A SaaS tracker is built around recurring revenue and retention. Most of these move slowly, so a monthly review is enough for the revenue figures.
| KPI | Formula | Typical frequency |
|---|---|---|
| MRR | Sum of monthly subscription revenue | Monthly |
| New MRR | MRR from new customers in the period | Monthly |
| Churn rate | Customers lost / customers at start of period | Monthly |
| Customer acquisition cost | Sales and marketing spend / new customers | Monthly |
| LTV:CAC ratio | Customer lifetime value / acquisition cost | Quarterly |
For the last row, our guide to the LTV:CAC ratio has a worked example and the payback calculation.
How to build a live KPI tracker in Plecto
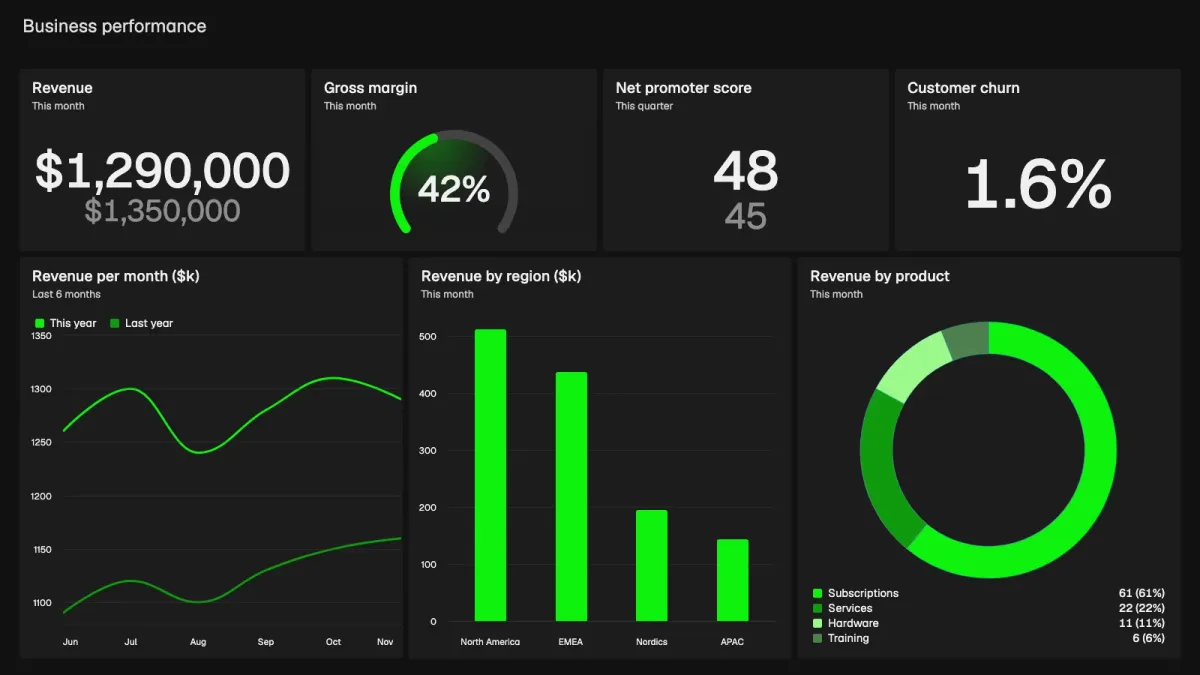
Plecto turns the spreadsheet layout above into a live KPI tracker that updates from the systems your team already uses. The columns map across directly: each KPI is a formula, the data source is an integration, the target is a number or a formula, and the status shows on the dashboard.
- Connect your data. Plecto connects to 150+ tools such as CRMs, telephony and helpdesks, and to Excel, Google Sheets, SQL and a REST API. Anything else can be registered by hand in a manual data source.
- Define each KPI as a formula. Write the calculation once and Plecto applies it the same way every time. Our custom KPIs page shows how, and the AI formula assistant can help draft one.
- Add targets. Keep targets in a spreadsheet and bring them in through a target data source, so each person or team is measured against their own goal.
- Build the dashboard. Number boxes, speedometers and column charts show the actual value against a target, and a number box can compare against the previous period for the trend column.
- Put it where people look. Show the dashboard on an office screen through a slideshow, on the mobile app or in a browser. Our TV dashboard guide covers the options.
- Add alerts and reports. A notification can trigger when a formula meets a target, for example booked meetings reaching 40. Reports can be exported to PowerPoint or Excel on a schedule for the weekly review (available on the Large and Enterprise plans).
If your KPIs already live in a sheet, you do not have to throw it away. A Google Sheets integration refreshes automatically every 15 minutes, so the sheet can stay as the input and the dashboard becomes the live view on top. See the Google Sheets integration and Excel integration for what each one supports. For how dashboards fit together, see real-time dashboards.
Common KPI tracker mistakes
Most trackers fail for ordinary reasons, and they are cheap to avoid.
- Too many KPIs. Thirty rows means nobody reads any of them. Cut to what drives a decision.
- No owner. Without a name next to a row, a red status gets discussed and nothing changes.
- Targets that never move. A target set in January and never revisited stops meaning anything by June.
- Vanity KPIs. Page views or calls made can look good while revenue falls. Pair every activity KPI with an outcome KPI.
- Hidden in a file. If the tracker lives in a folder nobody opens, it does not exist. Put it on a screen or in the weekly meeting agenda.
Conclusion: start small, then make your KPI tracker live
Copy the nine-column layout, add five to ten KPIs with a named owner each and review it on a fixed schedule. That is enough to learn which KPIs matter. Once people check the sheet daily and the manual updates become the bottleneck, move the same layout into live KPI tracking software. Start a free 14-day trial of Plecto to connect your data and build a live KPI tracker, no credit card needed.
Questions
Frequently asked questions about KPI trackers
At minimum: the KPI name, an owner, the formula, the data source, a target, how often it is reviewed, the current value, the trend and a status. The formula and data source stop arguments about the numbers. The owner and status make it clear who acts when a KPI is off track.
Five to twelve per team is a practical range. Fewer than five usually leaves gaps, and more than twelve makes it hard to see which ones matter. Start with the KPIs tied to your current goals and drop any that do not lead to a decision.
Yes, for a small set of slow-moving KPIs that one person updates. It stops working when the data comes from several systems, several teams need the same numbers daily, or the manual copy and paste becomes the bottleneck. That is the point to move to software that updates itself.
Match the update to how fast the KPI moves. Activity and support KPIs are worth checking daily, sales results weekly, and revenue or retention figures monthly. Software that pulls live data removes the update chore, so you only need to decide how often to review.
A KPI tracker is the list of KPIs with targets, owners and status. A KPI dashboard is one way to display it, with charts and gauges that update from live data. A spreadsheet tracker can be a dashboard of sorts, but a live dashboard removes manual updates and can be shown on a screen.
Yes. Connect the spreadsheet through the Google Sheets or Excel integration, or upload it to a manual data source, and build your KPIs on top of it. Many teams keep targets in a sheet and let Plecto show the live dashboard, so the spreadsheet stays as the input.
Start your 14-day free Plecto trial today.
Enjoyed the article? Share it:


