 Sign in

Sales Report Templates You Can Copy and Use This Week
Copy 7 sales report templates: daily, weekly, monthly, sales call, pipeline, funnel and rep performance, each with metrics, cadence and questions answered.

Need a sales report template you can use today? Below are seven, each with who it is for, how often to send it, the questions it answers and a table you can copy straight into a spreadsheet, a doc or an email. There are templates for a daily sales report, a weekly sales report, a monthly sales report, a sales call report, a sales pipeline report, a sales funnel report and a sales rep performance report.
The tables are inline, so there is nothing to download: select a table, copy it and paste it into Google Sheets, Excel or your CRM notes. If you want the metric definitions behind the columns, our guide to 21 sales KPIs explains each one.
What is a sales report?
A sales report is a summary of sales results and activity for a set period, such as a day, week or month. It compares what happened against targets and the previous period, and ends with what to do next. A sales report template is the reusable layout, so each report uses the same metrics in the same order.
A good report answers three questions: where are we against target, what changed since last time, and what should we do about it? Reports that only list numbers get skimmed. Reports that explain the gap and name the next step get used in meetings.
A sales report is not the same as a live dashboard. A dashboard shows the current state continuously; a report is a snapshot with commentary, sent to people who will not open the dashboard. Our guide to dashboards vs. reports explains when to use each.
What every sales report template should include
Whatever the cadence, a sales report template works best when it has the same six building blocks:
- Period and owner: the dates covered, the team or rep, and who wrote it.
- Headline result: revenue or bookings against target, in one line at the top.
- Comparison: the same metrics against the target and the previous period, so a number always has context.
- Pipeline or activity driver: the leading indicators (calls, meetings, new opportunities) that explain the result.
- Commentary: two or three sentences on why the numbers moved.
- Next steps: specific actions with an owner and a date.
Keep the metric list short. Five to eight rows per report is enough for most readers, and every row should be something a person can act on. If you are choosing what to measure, our guide to KPIs for sales managers is a good shortlist.
7 sales report template examples
Each template below uses fictional column headers you can rename to match your CRM. Fill in the "Target" column from your sales plan, not from last period, otherwise you only measure whether you repeated yourself.
Daily sales report template
For: reps, team leads and managers in high-volume or inside sales. Cadence: end of each day, read in two minutes.
A daily sales report is a short activity and results snapshot. It shows whether the team is on pace for the week and surfaces blockers while there is still time to fix them. Questions it answers:
- Did we hit today's activity and revenue goals?
- Which deals moved forward, and which stalled?
- What needs attention tomorrow?
| Metric | Today | Daily target | Week to date | Notes |
|---|---|---|---|---|
| Calls made | ||||
| Conversations / connects | ||||
| Meetings booked | ||||
| Demos held | ||||
| Proposals sent | ||||
| Deals won (count / value) | ||||
| Top blocker or next step |
Weekly sales report template
For: sales managers and the leadership team. Cadence: every Monday for the previous week, or Friday afternoon.
The weekly sales report is the one most teams need first. It balances results with the activity that drives them, which makes it the best place to spot a problem early. Questions it answers:
- Are we on track to hit this month's number?
- Which reps or stages are behind pace?
- What are the three actions for next week?
| Metric | This week | Target | vs last week | Notes |
|---|---|---|---|---|
| Revenue closed | ||||
| Deals won / lost | ||||
| New opportunities created | ||||
| Pipeline value (open) | ||||
| Win rate | ||||
| Meetings held | ||||
| Average deal size | ||||
| Forecast for the month |
Below the table, add three short sections: Wins (what worked), Risks (deals or reps behind) and Next week (actions with owners). The step-by-step guide later in this article shows how.
Monthly sales report template
For: sales leadership, finance and the executive team. Cadence: first week of the next month.
A monthly sales report zooms out from activity to trends. It compares the month with target, the previous month and the same month last year, and it feeds the forecast for the next quarter. Questions it answers:
- Did we hit the monthly and quarterly target?
- Which products, segments or channels drove the result?
- Is the sales cycle getting longer or shorter?
| Metric | This month | Target | vs last month | vs same month last year |
|---|---|---|---|---|
| Revenue / bookings | ||||
| New vs recurring revenue | ||||
| Win rate | ||||
| Average deal size | ||||
| Sales cycle length (days) | ||||
| Pipeline coverage for next quarter | ||||
| Quota attainment (team) | ||||
| Top 3 reasons for lost deals |
Sales call report template
For: reps logging calls, and managers who review them. Cadence: after every call, reviewed weekly.
A sales call report records what was said and what happens next. It keeps CRM notes consistent, makes handovers easier and gives managers material for coaching. Questions it answers:
- What did the prospect say about need, budget, timeline and decision makers?
- What was agreed, and who does what next?
- Which calls should be reviewed in a coaching session?
| Date | Contact / company | Purpose | Outcome | Objections raised | Next step | Follow-up date |
|---|---|---|---|---|---|---|
| Discovery / demo / follow-up | ||||||
Write the outcome in a sentence a colleague could act on, such as "Budget approved, needs security review before proposal." For tracking the volume side of calls, see our guide to sales activity tracking.
Sales pipeline report template
For: sales managers, revenue operations and the CEO. Cadence: weekly, with a deeper review monthly.
A sales pipeline report shows every open deal by stage, with its value and probability. It is the basis of the forecast, so it should make stalled deals obvious. Questions it answers:
- Is there enough pipeline to hit target?
- Which deals have not moved in two or more weeks?
- What is the weighted forecast for the period?
| Stage | Open deals | Total value | Win probability | Weighted value | Avg. days in stage | Stalled deals |
|---|---|---|---|---|---|---|
| Qualification | ||||||
| Discovery and demo | ||||||
| Proposal | ||||||
| Negotiation | ||||||
| Total |
Add one line below the table for pipeline coverage (open pipeline divided by the quota for the period). Our guide to the sales pipeline explains the stages, probabilities and coverage formula.
Sales funnel report template
For: sales and marketing leaders. Cadence: monthly or quarterly.
A sales funnel report measures conversion from one stage to the next, so you can see where prospects drop out. Unlike the pipeline report, which lists open deals, it counts people and rates over a period. Questions it answers:
- Which stage loses the most prospects?
- Which lead sources convert best?
- How long does a lead take to become a customer?
| Funnel stage | Entered stage | Moved to next stage | Conversion rate | Target rate | Avg. time in stage |
|---|---|---|---|---|---|
| Leads | |||||
| Marketing qualified leads | |||||
| Sales qualified leads | |||||
| Opportunities | |||||
| Customers |
Conversion rate is the number that moved to the next stage divided by the number that entered it. For ways to read the results, see our article on analyzing your sales funnel.
Sales rep performance report template
For: sales managers running one-on-ones and reviews. Cadence: monthly, with a quick weekly check.
This sales report template compares each rep with their own target and with the team. Its job is to start a coaching conversation, not to rank people. Questions it answers:
- Who is ahead of or behind quota, and why?
- Is a weak result caused by activity, conversion or deal size?
- Which rep needs help, and with what?
| Rep | Quota | Revenue closed | Attainment % | Win rate | Meetings held | Pipeline coverage | Coaching note |
|---|---|---|---|---|---|---|---|
| Team |
Read across each row. A rep with low revenue but high win rate usually needs more pipeline; low win rate with plenty of meetings points to a skills gap.
How to write a weekly sales report
A weekly sales report takes about 20 minutes once the template is set. Follow these steps:
- Pick the audience. A team meeting needs rep-level detail; the CEO needs the headline and the risks.
- Pull the same metrics every week. Use one source of truth, usually your CRM, and the same definitions each time.
- Compare, do not just list. Add target and last-week columns to every metric.
- Write the headline first. One sentence: "We closed $X, Y% of the weekly target, and the month is on/off track."
- Explain the biggest movement. Pick the one or two numbers that changed most and say why.
- Flag risks. Name stalled deals, thin pipeline or reps behind pace.
- End with actions. Each next step gets an owner and a date.
- Send it at the same time every week. Consistency builds the habit of reading it.
Common sales report mistakes
- Too many metrics. Ten rows that matter beat forty that do not.
- No target column. Without a target, a number has no meaning.
- Mixed definitions. If "pipeline" means different things to different reps, the report cannot be trusted.
- Numbers without commentary. Readers should not have to guess the story.
- Only lagging results. Revenue tells you what happened; calls, meetings and new opportunities tell you what will.
- Building it by hand every week. Manual copying causes errors and takes time away from selling.
Automate your sales report template with Plecto
Copying numbers into a spreadsheet every Monday is the part of reporting that teams most want to drop. Plecto reports pull from the data sources you already connect (150+ integrations, plus API, SQL and Excel or Google Sheets), so the figures are the same ones on your dashboards.
You can export a report as PowerPoint or Excel, or schedule hourly, daily, weekly or monthly exports that arrive in your inbox, so the weekly report can be waiting before your Monday meeting. Reports are available on the Large and Enterprise plans.
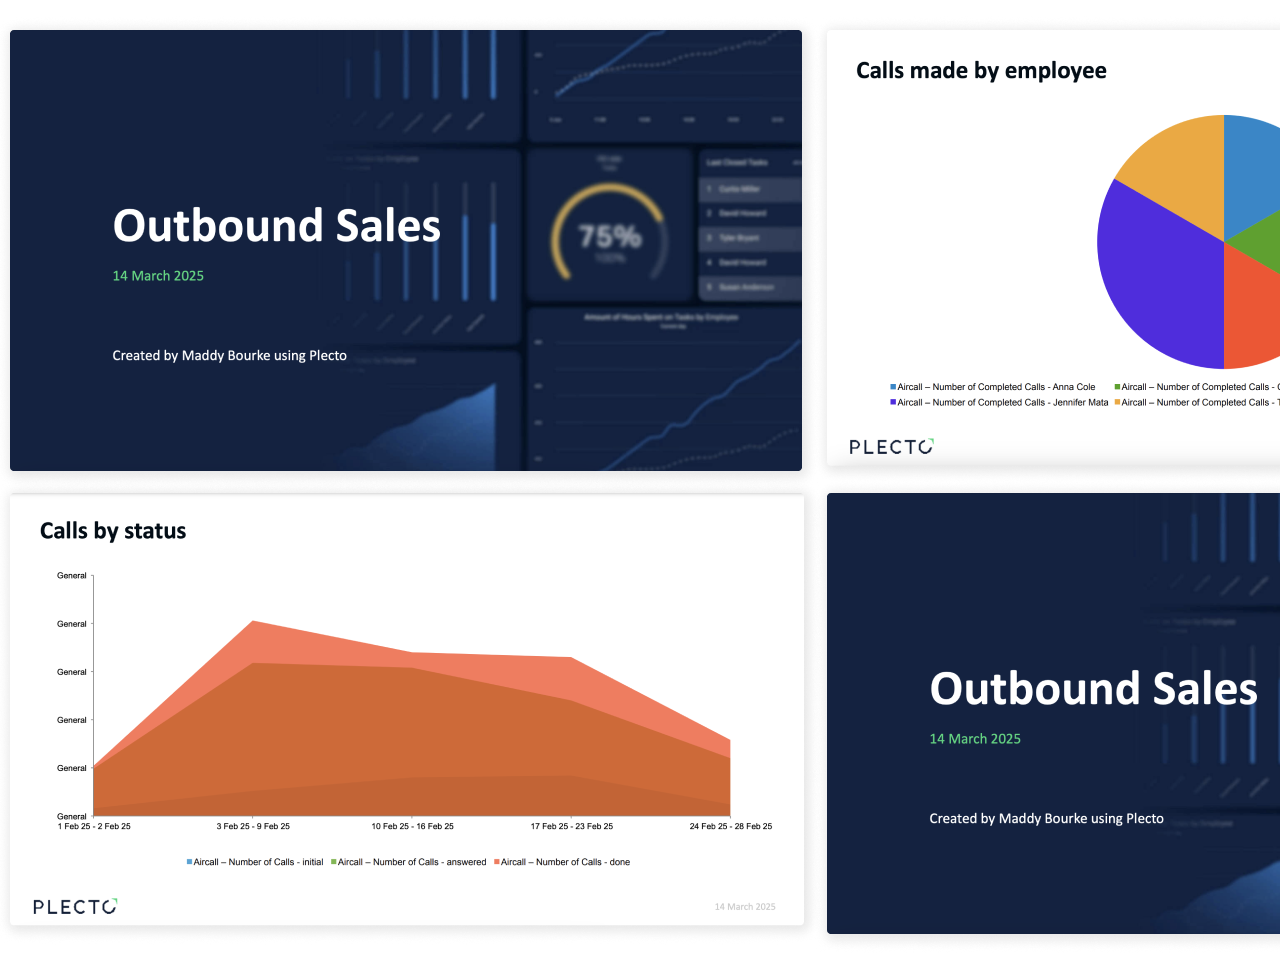
For the build steps, follow our guide to creating a sales report in Plecto. For general KPI reporting, see KPI reports.
Choosing the right sales report template
Start with the weekly sales report, add the pipeline report once your forecast matters, and use the rep performance report for coaching. Keep every sales report template short, comparable week to week and tied to a next step. When you are ready to stop copying numbers by hand, see how Plecto reports automate it.
Questions
Sales report template FAQs
A sales report template should include the period covered, headline revenue against target, a comparison with the previous period, the pipeline or activity numbers that drive results, short commentary on why numbers moved and next steps with owners. Keep it to five to eight metrics so readers can act on it.
Pull the same metrics each week from your CRM, compare them with target and last week, and write a one-sentence headline first. Then explain the biggest movement, flag risks such as stalled deals, and end with actions that have an owner and a date. Send it at the same time every week.
A sales pipeline report lists open deals by stage with their value and probability, which supports forecasting. A sales funnel report measures conversion rates between stages over a period, which shows where prospects drop out. Use the pipeline report to manage deals and the funnel report to improve the process.
Send a short daily report to reps and team leads in high-volume sales, a weekly report to managers, and a monthly report to leadership and finance. Match the cadence to how fast decisions are made. If nobody acts on a daily report, move it to weekly.
A sales call report is a short record of a call: the date, the contact and company, the purpose, the outcome, objections raised, the next step and the follow-up date. It keeps CRM notes consistent, helps with handovers and gives managers examples to use in coaching.
Yes. Connect your CRM and other sources to a reporting tool, build the report once and schedule it. In Plecto you can export reports as PowerPoint or Excel and schedule hourly, daily, weekly or monthly exports by email. Reports are available on the Large and Enterprise plans.
Start your 14-day free Plecto trial today.
Enjoyed the article? Share it:


