 Log ind

Performance Dashboard
Performance dashboard: track business, team and employee performance live
A performance dashboard shows how the business, each team and each employee are doing against their goals, while the day is still running. Plecto connects your tools, colors every KPI against its target and puts the result on desktops, mobile and office TVs.
What is a performance dashboard?
A performance dashboard is a screen that shows how a business, team or employee is doing against set goals, using live KPIs compared with targets. Plecto builds them from your CRM, phone system and helpdesk data and colors each KPI green, yellow or red, so people see what is on track at a glance.
It is a close cousin of the business dashboard and the KPI dashboard. The difference is the question it answers: not "what are our numbers?" but "are we meeting our goals, and who or what needs attention?"
- Performance dashboard vs KPI dashboard: a KPI dashboard shows a set of metrics. This one always sets those metrics against targets and usually breaks them down by team or person.
- Performance dashboard vs report: a dashboard is the live view for acting today. A report is the summary for a week or month, built from the same formulas.
Types of performance dashboards
Most companies need more than one, because the leadership team, a team leader and an individual employee look for different things. This table shows the common types, who uses them and where to see an example.
| Type | Who uses it | Typical KPIs | Example |
|---|---|---|---|
| Business performance dashboard | Leadership, finance | Revenue, gross margin, churn, NPS | Business dashboard and executive dashboard |
| Team performance dashboard | Team leaders, whole teams | Goal attainment, deals won, CSAT against team targets | KPI dashboard software |
| Employee performance dashboard | Managers and the employee | Result against personal target, quality score | Performance agreements |
| Sales performance dashboard | Sales managers, reps | Won value, win rate, calls, pipeline | Sales performance dashboard |
| Agent performance dashboard | Support and call center leads | Tickets solved, first response time, CSAT, handle time | Customer service agent dashboard and call center dashboards |
| Store performance dashboard | Retail and store managers | Sales per store, conversion, targets per location | Store performance dashboard |
Business performance dashboard example
Revenue, margin, customers and growth
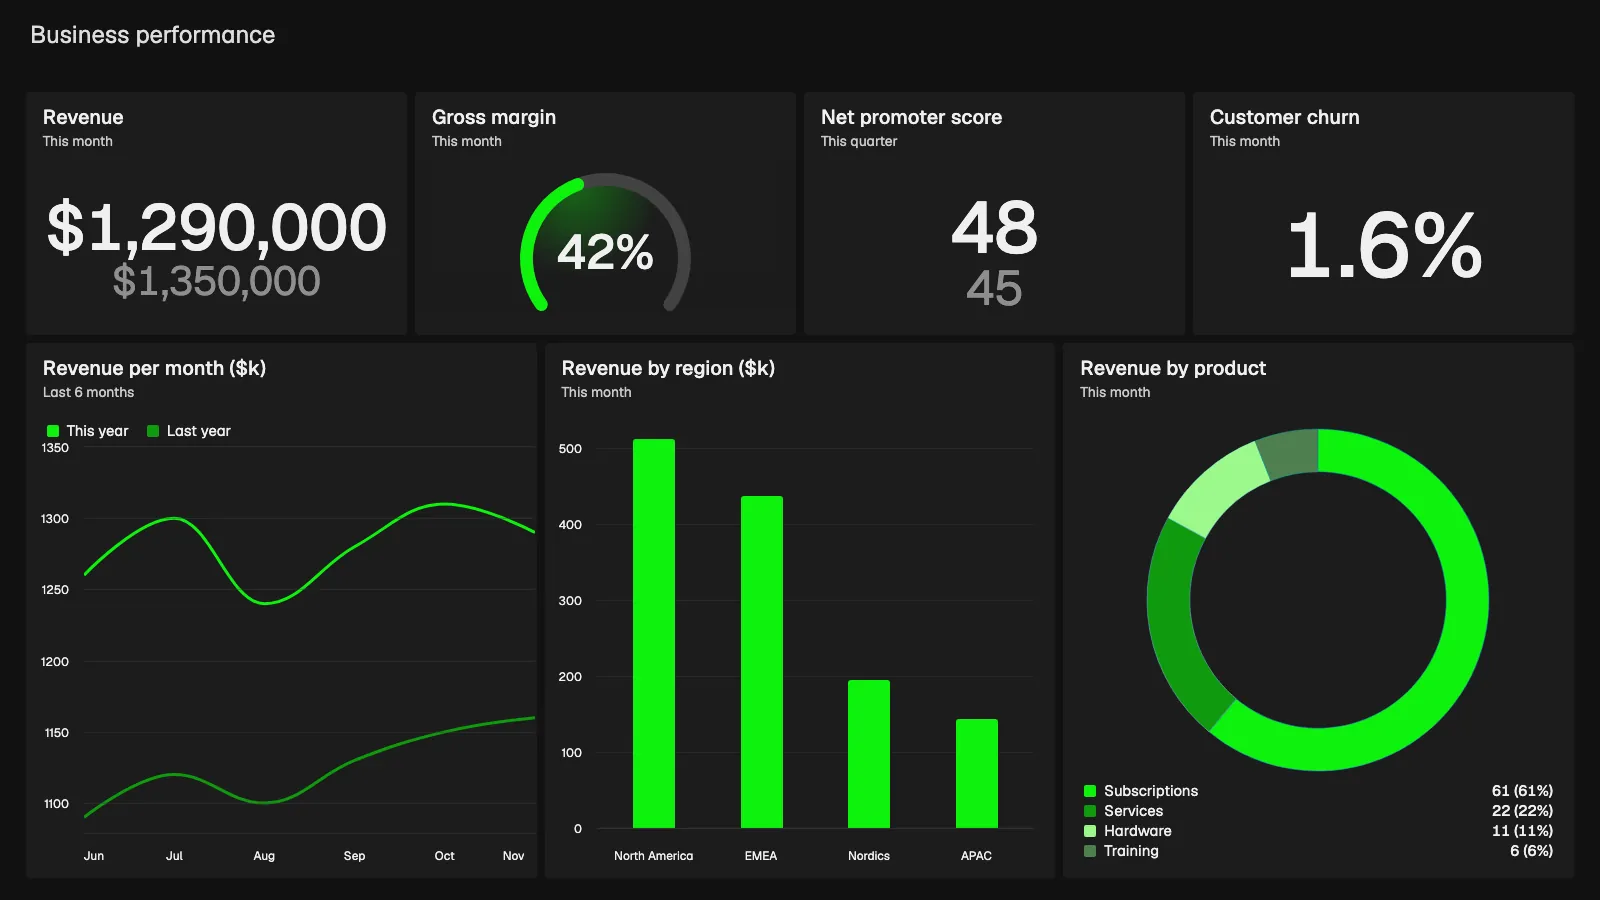
This demo board is built with Plecto widgets and example data. The top row shows revenue this month at $1,290,000 against a $1,350,000 target, a gross margin gauge at 42%, a net promoter score of 48 against a target of 45, and customer churn of 1.6%.
Trend, region and product mix
The bottom row shows revenue per month for the last six months against last year (this November: $1,290k, last year: $1,160k), revenue by region (North America $512k, EMEA $438k, Nordics $196k, APAC $144k) and revenue by product, with subscriptions at 61%. Leadership sees where the month stands and where it comes from. See the executive dashboard for more.
Team performance dashboard example
One goal table for every team
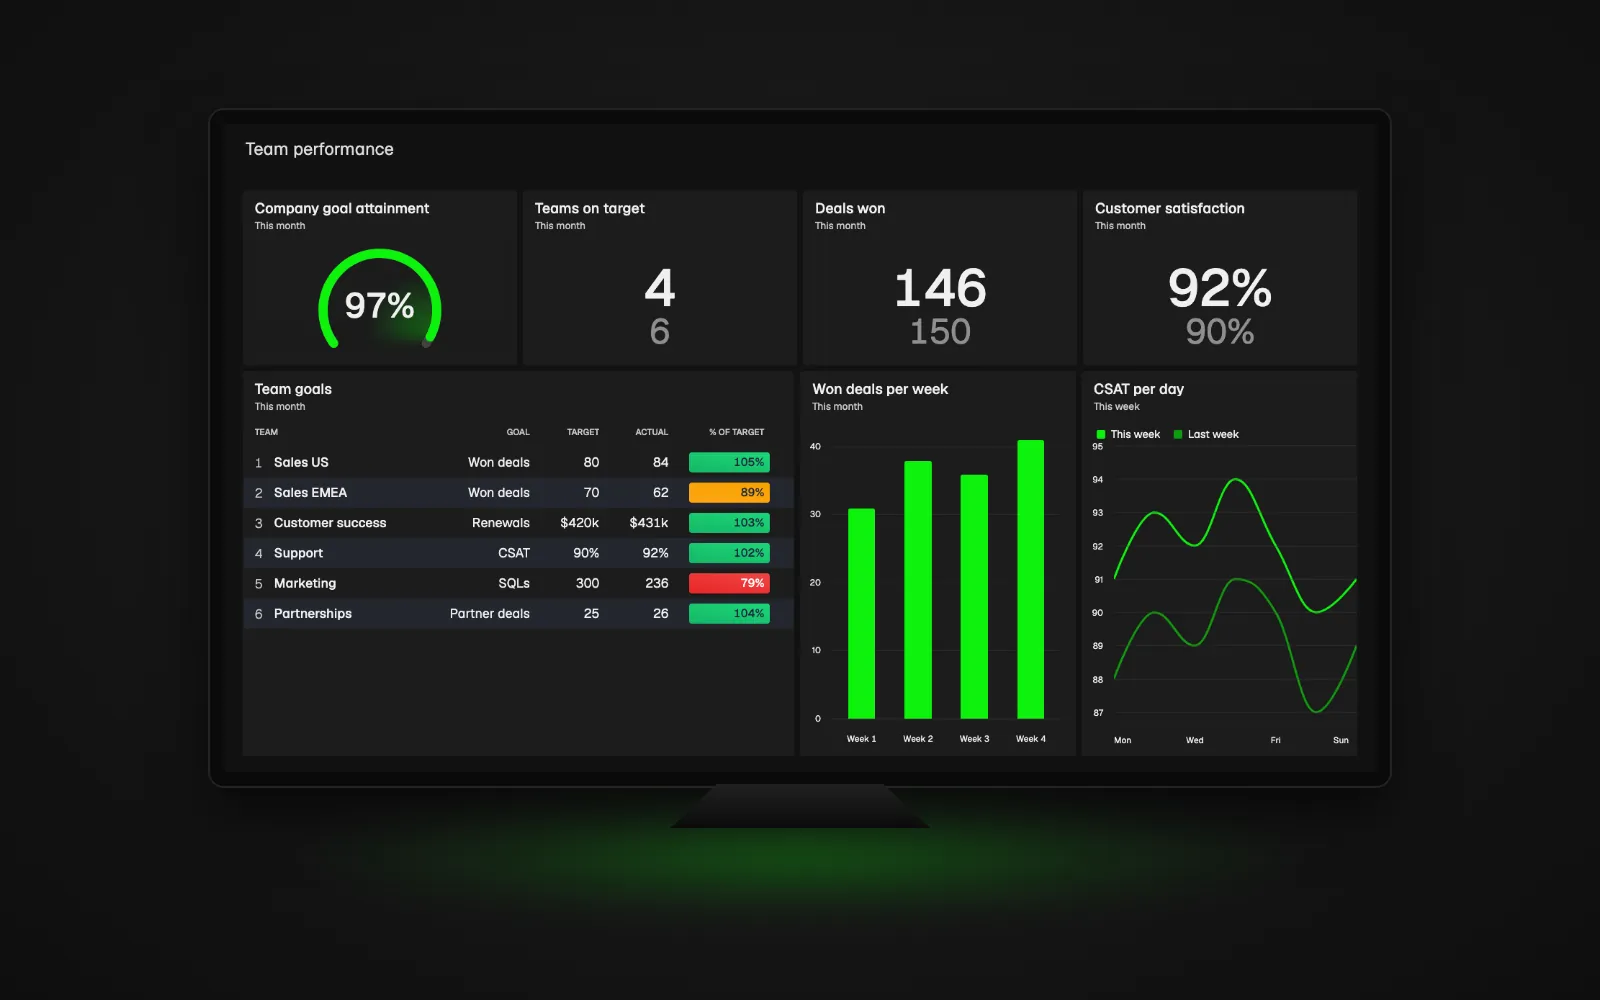
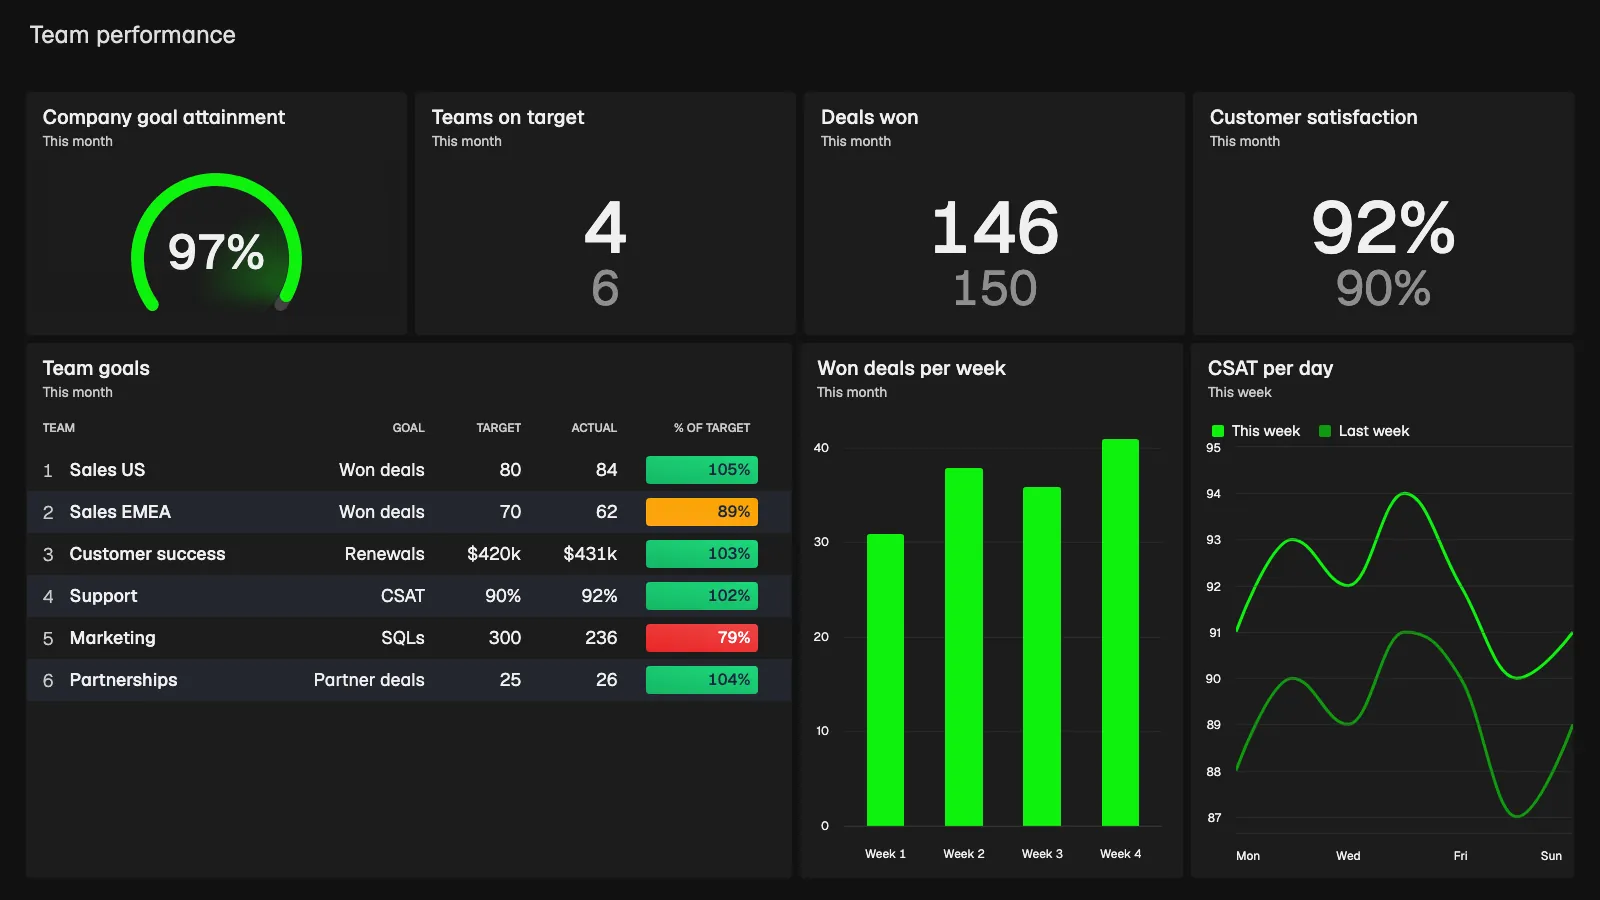
This demo board uses example data. The top row shows company goal attainment at 97%, 4 of 6 teams on target, 146 deals won against 150, and customer satisfaction at 92% against a 90% target.
The goal table lists each team with its target, actual and percentage of target. Sales US won 84 deals against 80 (105%), Sales EMEA 62 against 70 (89%), Customer success $431k in renewals against $420k (103%), Support 92% CSAT against 90% (102%), Marketing 236 SQLs against 300 (79%) and Partnerships 26 deals against 25 (104%). Green means at or above 100%, yellow 85 to 99% and red below 85%.
Built to be seen on a TV
Won deals per week (31, 38, 36 and 41) and CSAT per day sit beside the table. This is the board shown on the office TV at the top of the page. For screen setup, read the TV dashboards guide.
Employee performance dashboard example
Result, target and quality side by side
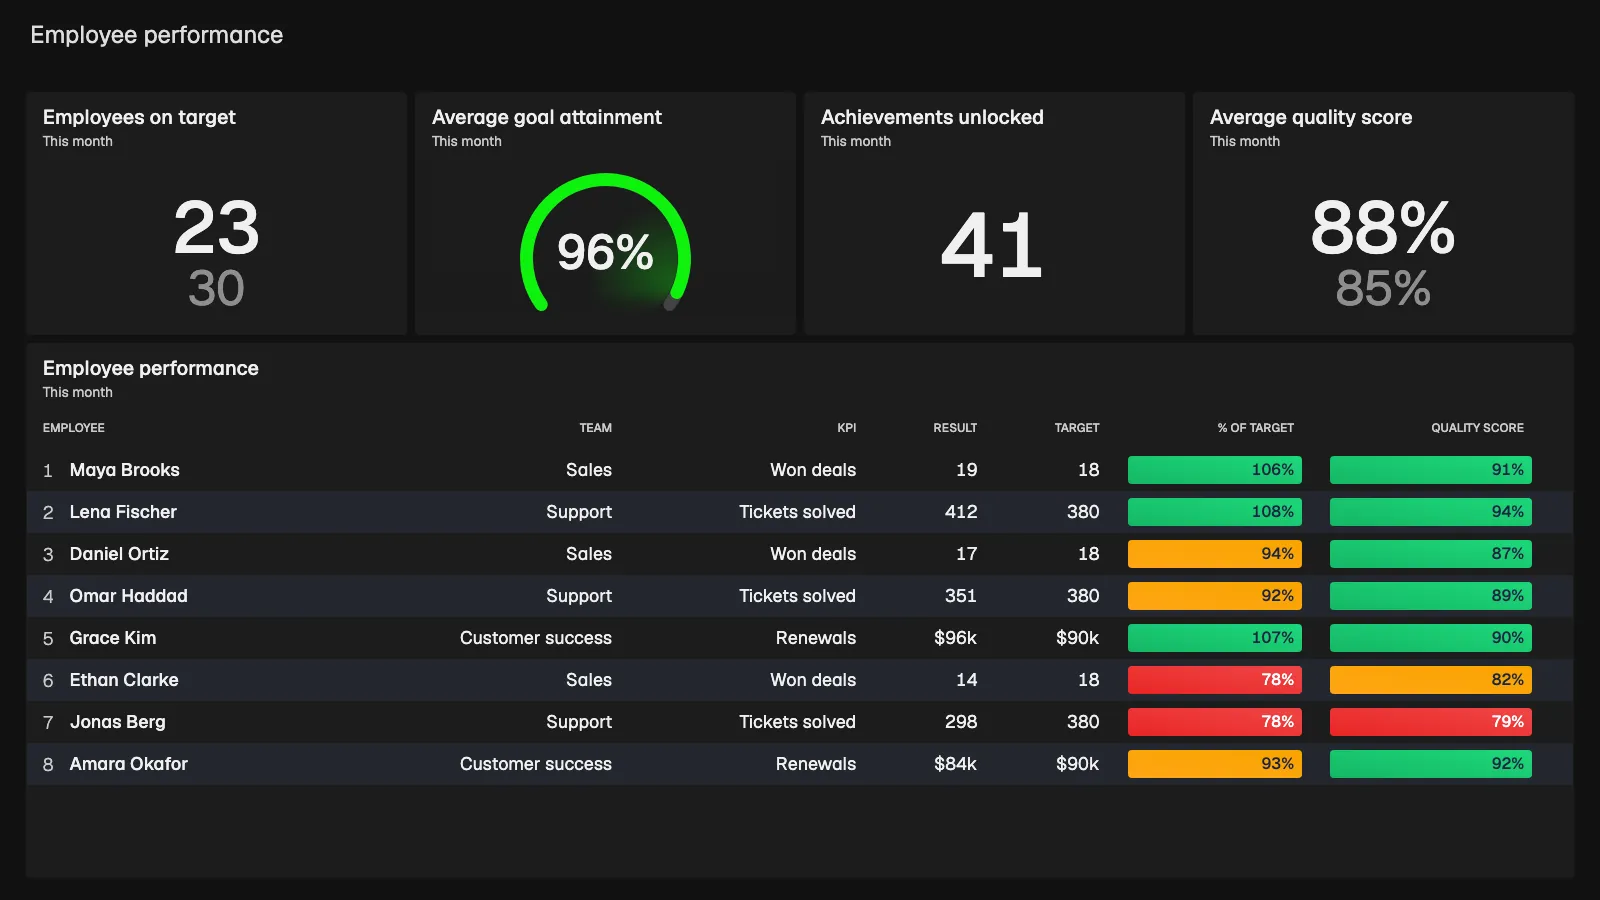
This demo board also uses example data with fictional people. It shows 23 of 30 employees on target, average goal attainment of 96%, 41 achievements unlocked this month and an average quality score of 88% against 85%.
The table gives each person a team, a KPI, a result, a target, percent of target and a quality score. Maya Brooks in Sales has 19 won deals against 18 (106%, quality 91%). Lena Fischer in Support solved 412 tickets against 380 (108%, quality 94%). Jonas Berg in Support is at 298 tickets (78%) with a quality score of 79%, which is red on both measures.
Two measures beat one
Showing volume and quality together stops people gaming one number, and it tells a manager which conversation to have. A low result with high quality is a coaching topic. A high result with low quality is a different one.
What should a performance dashboard include?
A dashboard like this works when people can read it in a few seconds. These design principles come from the examples above. Plecto's own dashboard best practices go deeper.
- A target on every KPI. A number without a goal is only a number. Show the target next to the result, as in "146 / 150".
- Conditional colors. Use green, yellow and red with clear thresholds, for example 100%, 85% and below. Set them with conditional colors.
- The right time period. Today for operations, this week or month for goals, this quarter for strategic KPIs such as NPS.
- A comparison. Last week or last year on a line chart shows whether a number is moving, not only where it is.
- A breakdown by team or person. A leaderboard or table shows where the total comes from.
- Few KPIs, grouped. Aim for 4 to 8 numbers per screen. If you need more, make a second dashboard.
- One measure for output and one for quality. Pair tickets solved with CSAT, or deals won with win rate.
For a KPI performance dashboard, start with the three to five KPIs a team can influence directly, and browse the KPI library for definitions. Good starting points are net promoter score, customer satisfaction (CSAT) and win rate of deals.
Sales performance dashboards: see the full examples
Sales is the most common starting point, because the targets are clear. This page keeps the sales view short on purpose. For the team view, each salesperson and one rep's own scorecard, go to the sales performance dashboard examples.
If you run stores, the store performance dashboard shows sales per location against target. To compare tools for managing sales performance, see sales performance management software.
Employee performance dashboards that motivate instead of monitor
An employee performance dashboard can feel like surveillance if it only exists to catch people. The same screen can do the opposite when it is built around goals people understand and can influence. These are the habits that make the difference:
- Be transparent about what is measured. Tell people which KPIs are on the dashboard, how they are calculated and why they matter.
- Use targets that fit the person. A new hire and a veteran should not share one number. Performance agreements let managers set personal targets and follow progress confidentially.
- Recognize progress, not only the top. Achievements and streaks reward consistency. See how gamification works in Plecto.
- Use the data for coaching. Bring the dashboard into one-on-ones, and talk about the next step instead of the red number.
- Show quality next to volume. It makes the picture fairer, as in the employee example above.
For a longer guide, read how to do employee performance tracking.
How to build a performance dashboard in Plecto
- Connect your data. Go to Data sources > New data source and pick your CRM, phone system, helpdesk or finance tool. Plecto has 150+ integrations, and the REST API and spreadsheets cover the rest. See all integrations.
- Define your KPIs. Go to Formulas > New formula to build the numbers, such as won deals, tickets solved or CSAT. Follow the guide on how to create a formula.
- Set targets and colors. Add a target to each KPI and set conditional colors so status shows at a glance.
- Build the dashboard. Go to Dashboards and add the KPIs as widgets such as gauges, number boxes, tables, leaderboards and charts. See how to create a dashboard.
- Share it where people look. Add the dashboards to a slideshow and open it on an office TV, and use the same dashboards on desktop and in the Plecto mobile apps. See dashboards.
- Add reports and notifications. Go to Notifications > New notification to alert people when a KPI meets a condition, and use reports for the weekly or monthly summary.
Plecto offers a 14-day free trial with no credit card required. See pricing.
Performance dashboard FAQ
A performance dashboard is a screen that tracks how a business, team or employee is doing against goals, using live KPIs compared with targets. In Plecto it pulls data from your CRM, phone system and helpdesk and colors each KPI by status. See the business dashboard page for a broader view.
A performance dashboard should include a small set of KPIs, a target next to each one, conditional colors, a clear time period, a comparison with a previous period and a breakdown by team or person. Pair output with quality, such as tickets solved with CSAT. See the KPI library for ideas.
A KPI dashboard shows a set of key metrics. A performance dashboard sets those metrics against targets and usually splits them by team or person, so you can see who is on track. A KPI performance dashboard does both, and Plecto builds them from the same formulas. Read more about KPI dashboard software.
Connect the data sources where employees work, build a KPI for each person's result and quality, set targets, and add a table or leaderboard grouped by employee. In Plecto, personal targets come from performance agreements. Share the dashboard with the team and use it in one-on-ones. See the employee performance tracking guide.
It depends on the use. Power BI and Tableau fit analysis of modeled data, and Grafana fits engineering metrics. Plecto fits live team and employee performance dashboards on TVs, with targets, leaderboards, notifications and gamification from CRM, phone and helpdesk data. Our TV dashboard software comparison covers the options.
It depends on the decisions it supports. A sales floor or service desk benefits from updates every few minutes, while a monthly finance view can refresh slowly. In Plecto, many integrations update every two minutes, and some, such as HubSpot deals, arrive instantly through webhooks. Dashboards can show today, this week or this month.
Start building your performance dashboard today.
14-day free trial. No credit card required.